Net worth of adults approaching retirement age: Personal health, presence of a chronically ill or disabled household member, and out of home caregiving
Patricia Patty Stoddard Dare, Cleveland State University
Linda M. Quinn, Cleveland State University
Shirley L. Porterfield, St. Louis University
LeaAnne DeRigne, Florida Atlantic University
Miyuki Tedor, Cleveland State University
Cyleste Collins, Cleveland State University
Introduction
The US population is aging. As a result, an increasing number of workers, many in their prime earning years, will be called upon to provide care for older relatives and friends who live either within or outside of the worker’s household (Caputo et al., 2016). Caregiving for others may occur over a number of years, as when parents are caring for a child with disabilities into their adult years, or for a shorter period of time, as when caring for a spouse or an older parent. As the COVID-19 pandemic has made clear, caregiving expectations may arise unexpectedly. Unpaid caregiving and paid employment both compete for a working adult’s time. Over the life course, moving in and out of the labor market to meet caregiving needs of relatives or friends with chronic illness or disabilities may create economic turmoil in households that also may face increased need for costly health care-related goods and services (Parish et al., 2009; N.N.; Seltzer et al., 2001). A report from the National Alliance for Caregiving indicates that even before the pandemic, 70% of workers who provided care to elderly or disabled family members made adjustments to their work in order to handle caregiving activities, with impacts on take home pay and net worth for some individuals (NAC & AARP, 2015). The COVID-19 pandemic has further highlighted the need for structural changes to preserve the financial well-being of caregivers (van Dalen & Henkens, 2020).
Financial Security in Retirement and Marital Status
Over the past 35 years, American employers have shifted much of the risk and responsibility associated with retirement savings to workers. It is generally agreed now that saving for retirement should begin with the first job, if possible, to take advantage of interest that compounds over the working life (Sherraden et al, 2018). The goal is to save enough, in conjunction with Social Security and defined benefit pensions, to replace a substantial portion of earned income with income from pensions and other assets during retirement years. Estimates of how large this portion should be varies from 67 to 80 percent, with an average target replacement rate of 73 percent (Munnell et al., 2014).
A reasonable depiction of financial resources available to families in retirement is total family or household net worth (Bricker et al., 2017; US Census Bureau, 2020; BLS, 2020). Among families approaching retirement age in 2016 (age of the household head was between 55 and 64 years) average wealth, as measured by net worth was $1,167,400 while median net worth was $187,300 (Bricker et al., 2017). Net worth includes these assets: home value, value of farm, business, or real estate, value of vehicles, value of stocks, bonds, mutual funds, CDs, trusts, defined contribution pension plans (IRAs, keogh, 401(k)s, 403(b)s), cash savings, and value of other assets like jewelry or collections. Deducted from these assets are mortgages and other residential debt, debts of farm, business, or real estate, debt of vehicles, and other debts owed such as credit cards or student loans (National Longitudinal Surveys, n.d.). Following the “Bengen rule” which recommends a 4% rate of withdrawal in retirement, these figures would annually yield $7,500 to just under $50,000 in income (Bengen, 1994) if it were all in liquid assets. However, over one-third of net worth is tied up in non-liquid assets such as owner-occupied homes that are less easily used to supplement income (Eggleston & Monk, 2019). Although homeownership rates (63.8% on average across 2014-2018) have dropped in the past decade, they are still higher than ownership rates of retirement savings accounts (52% in 2016) or access to defined benefit pension plans through an employer or union (26% in 2019, though enrollment in such plans is higher among older workers). Of course, retirees may have other sources of income that are not included in net worth, such as Social Security and employer-sponsored defined-benefit pensions; yet, half of American households are estimated to be at risk of falling short of their target replacement income in retirement (Munnell et al., 2018).
Household structure and gender are both key predictors of household wealth (Ulker, 2009; Maroto & Aylsworth, 2017). Married, stable, two-adult households fare best, with significantly higher net worth than single-adult households (Maroto & Aylsworth, 2017). These differences by marital status and gender are seen in young adulthood as differences in homeownership (Grinstein-Weiss et al., 2011) and defined contribution retirement savings (Knoll, Tamborini, & Whitman, 2012; Tamborini & Purcell, 2016). The monetary values associated with these choices are strongly affected by changes in marital status and magnify over the life course (Ulker, 2009).
Financial Aspects of Caregiving
Financial aspects of caregiving include both direct activities related to the financial health of the care recipient and indirect effects of providing care that fall on the caregiver. Direct activities have been tabulated in a recent study, finding 88% of caregivers provide financial coordination (paying bills, filing taxes) for a care recipient, while 68% of caregivers are labeled as financial contributors, actually providing financial support for the care recipient (Merrill Lynch/Age Wave, 2017). Although in one survey just over half of caregivers say they have no idea how large their financial contribution to the care recipient has been, and three-quarters say they “have never discussed their financial role with their care recipient” (Merrill Lynch/Age Wave, 2017, p 24), in another survey, 78% of caregivers report spending nearly $7,000 on average in 2016 in out-of-pocket expenses associated with caregiving (Rainville, Skufca & Mehegan, 2016). Those caring for someone who lives more than an hour away or in their own home experience higher financial costs (Rainville, et al., 2016). Expenditures for these long-distance caregivers are dominated by travel costs and paying for help with caregiving (Rainville, et al., 2016). Sixteen percent of caregivers report they have reduced contributions to their own retirement accounts, and 33% report using personal savings to help pay for caregiving expenses (Rainville et al., 2016).
Caregiving for someone who is at the end of life results in higher financial costs for the caregiver than caregiving for someone with a chronic illness or disability (Williams, et al., 2014; Rainville et al., 2016). Arora (2016) examined the wealth accumulation of unmarried children of parents with dementia, finding this diagnosis leads to significantly lower growth in wealth over time among these unmarried children relative to peers whose parents have no dementia diagnosis, only for those with wealth above the median value and regardless of their reported role as informal caregivers.
There are also indirect effects of caregiving for a relative or friend who lives either in or outside the home of the caregiver. Caregiving takes time and may require the caregiver to adjust time spent at work in order to complete caregiving tasks. A recent review of empirical studies published between 2006 and 2016 concludes that women caregivers of older parents both work fewer hours and are more likely to reduce work hours than women who are not in this type of caregiving role (Moussa, 2019). National surveys of caregivers, as discussed earlier, also attest to the tradeoff between paid work and caregiving (NAC & AARP, 2015).
Health of Household Members
Not surprisingly, families who have a household member with a limiting health condition are often at an increased risk for economic hardship. Chronic illness or disability (CIOD) includes conditions such as Alzheimer’s, autism, diabetes, blindness, hearing loss, and epilepsy. Conditions that are chronic are not necessarily disabling, and may or may not prevent full engagement in work, school or other activities of daily living. Past research has shed light on the vulnerability that may exist in households that have a CIOD member. Poor health has been identified as a significant risk factor for leaving paid employment and transitioning to unemployment, a disability pension, or early retirement (van Rijn, Robroek, Brouwer, & Burdorf, 2014). Longitudinal analysis of the Panel Study of Income Dynamics (PSID) suggests that work disability often has its origins in poor health early in life, with the associated economic disadvantages accumulating over the life course (Shuey & Willson, 2019). Some individuals with CIOD may have restrictions in the number of hours they are able to work as a result of their condition, or may be unable to work all together. Further, families with a CIOD family member tend to have a lower total family income and are less likely to own a home (Shuey & Willson, 2019). These families may also have higher expenses due to needed medications and medical services and equipment. Generally, having a family member or members with a limiting health condition places a family at higher risk of inability to afford timely health care, needed prescriptions, an adequate supply of nutritious food, and the resources to pay monthly bills (N.N., N.N., N.N .).
Caregiving and Health
Poor and declining health among adults caring for others relative to non-caregivers has been extensively documented in the literature. Mental and physical health effects have been found among those who care for older adults and those caring for children with disabilities. For example, a recent longitudinal study using the HRS reported a differential decline in mobility and cognition, along with an increase in the probability of stroke among caregivers (Unuigbe et al., 2017). Another HRS study showed women caregivers who experienced declining health over the 8 year study period were twice as likely to live in poverty in their retirement years as non-caregiver women with declining health (Wakabayashi & Donato, 2006). Caregiving has been associated with the onset of depression, though the duration of caregiving does not seem to worsen depression (Capistrant et al., 2014) nor has caregiving duration been found to impact telomere length (Chang et al., 2018; Rej et al., 2019). Although point-in-time, a study using Behavioral Risk Factor Surveillance System (BRFSS) data to examine the impact of caregiving for adults with intellectual or developmental disabilities (IDD) or mental illness found poorer health status among caregivers, with a higher number of days with diminished physical and mental health reported by caregivers than by non-caregivers (Barnhart et al., 2020). Similar results were found in a survey dominated by long term (more than 10 years of caregiving) caregivers for family members with IDD (Anderson et al., 2018). Caregiver physical and mental health has declined during the COVID-19 pandemic (Park, 2020).
Study Aim
This study examines whether work-limiting health conditions, the presence of a CIOD household member, and caregiving inside or outside of the home in the years leading up to their retirement relates to their family net worth. Our research also examines how these patterns may vary based on marital status. Covariates influencing the value of family net worth are also identified. Although it is clear that caregiving and health status help predict financial status, we are not aware of a study that has examined both health status and caregiving over time on a measure of wealth, net worth, for a group of adults approaching retirement age. Our detailed analysis of the contributions of caregiving, personal health, and having a CIOD household member on TFNW for married and unmarried adults approaching retirement age is unique to this study. Family net worth provides an estimate of the resources available to financially support older adults in their retirement years. Understanding the patterns of disability, health limitations, and caregiving over time is an important first step toward finding policy solutions to support the most vulnerable families and advancing equity.
Research Questions:
1. What is the distribution over time of caregiving, having a work limiting health condition, and having a household member with a CIOD in adults nearing retirement age?
2. What is the relationship of the respondent to the person with a CIOD in households who have a chronically ill or disabled family member and how does this differ by marital status over time?
3. What are the patterns of caregiving (in home, out of home, hours spent on caregiving) for married and unmarried respondents over time?
4. Is there is a difference in TFNW in households with and without a CIOD family member regardless if a respondent identified that they were the caregiver for the person with a CIOD?
5. What is the relationship over time between having a work limiting health condition, having a CIOD family member, and caregiving outside the home on total family net wealth while controlling for six time-variant variables (education, employment, insurance, defined benefit plan, number of children in the household, and total family net income) and three time-invariant variables (gender, age, race/ethnicity) in the years leading up to retirement?
6. What is the impact on TFNW of having a CIOD household member over time?
7. What is the additive effect on TFNW of having a work limiting health condition and having a household member with a CIOD for married and unmarried respondents?
Method
Analytic Sample
The National Longitudinal Survey of Youth 1979 (NLSY79) is a panel study of Americans born between the years of 1957 and 1964. All questions in the NLSY79 are self-report. A stratified, clustered sampling design was used to select non-institutionalized participants who were representative of the civilian population of youth ages 14 to 21 years in 1979. Participants were interviewed annually through 1994, then interviewed biannually since. The study presented here used survey results from 2008, 2012, and 2016 because the NLSY79 did not collect information on chronically ill or disabled household members before 2008, and total family net worth was not calculated for 2010, 2014, or 2018. There were 7,757 respondents interviewed in 2008, 7,300 respondents interviewed in 2012, and 6,912 respondents interviewed in 2016. Of these, 4,645 had valid data for the dependent variable at all three-time points. After adjusting dollar figures to 2016 dollars (using the CPI-U), respondents with a total family net worth more than two million dollars in wealth or debt at any of the three time points were eliminated (n=239). Of the remaining respondents, those who had a missing value on any of the key explanatory variables (n=747) were also eliminated. The final analytic sample consisted of 3,614 respondents who had complete information for all variables used in the study.
Measures
Dependent Variable
In the NLSY79, total family net worth (TFNW) is compiled by NLSY79 staff from several self report survey questions asked of respondents every other survey year summing all of the respondent’s assets and subtracting all debts in the previous calendar year. As described earlier in this paper, a full description of the NLSY79 methodology has been reported elsewhere (NLSY, ND). TFNW is the most comprehensive variable measuring family financial resources available in NLSY79, and there were fewer cases with a missing value, compared to other asset variables largely because NLSY79 uses imputation methods. Although reliance on defined benefit pension accounts is declining over time as employers shift long-term pension risk to workers, these accounts do provide about 20% of retirement income received by current retirees, on average (SSA, 2016, Table 10.1). However, they are not included in net worth because their value, which depends on longevity of the retired employee and financial stability of the employer or multiemployer plan, is difficult to calculate (Bond & Porell, 2020).
Within the NLSY79, the distribution of TFNW was positively skewed. When the distribution was censored at two million dollars at both ends (wealth and debt), the distribution of TFNW and the regression residuals were nearly normally distributed. The residual analysis using the traditional transformation, the inverse hyperbolic sine, was more problematic than using the censored, true data values. Using TFNW in the original unit also has the added benefit of a direct interpretation of regression coefficients in dollars. All analyses in this study, therefore, utilize TFNW in the original measurement after excluding above two million dollars TFNW holders. All TFNW were adjusted to the 2016 value using the CPI-U correction factors, and all values were reported in thousands of dollars for ease of presentation. Because the 2008 value reflects the respondents’ 2007 calendar year experiences, the 2012 values reflect the Great Recession that occurred December 2007 to July 2009.
Time-variant stratification variable
Total family net wealth is typically larger when it involves the possibility of a two income household. Therefore, results were stratified by marital status, as either married with spouse present or unmarried (which included never married, divorced, separated and widowed individuals).
Time-variant independent variables
The primary independent variables of interest are all time-varying for this study and were reported at each time point. They were whether or not the respondent reported having a work-limiting health condition, whether or not there was a CIOD member other than the respondent living in the household, and whether or not the respondent had caregiving responsibilities. Referent categories are no work-limiting health condition and no CIOD member in the household.
Respondents were asked if they had a health condition that limited their work for pay on a job. This was treated as a dichotomous variable with no limiting health condition used as the reference category.
Respondents were also asked for each member of the household on the roster if the member was chronically ill or disabled. When CIOD members were present within the household, these members were identified by their relationship to the respondent. The CIOD variable was coded as an indicator variable with no CIOD members as the reference category and all other values combined together. The number of CIOD members in a household ranged from one to four, this was dichotomized to 0=no CIOD members in the household, and 1=1 or more CIOD members in the household.
To measure in-home caregiving, an additional question asked whether or not the respondent identified as a caregiver for the CIOD household member. Respondents were asked, “Do you regularly spend time helping or taking care of a relative or friend who lives in your household?” To measure their out of home caregiving responsibility, respondents were asked, “Do you regularly spend time helping or taking care of a relative or friend who does not live in your household?” Each of these variables were separately coded as caregiver or not caregiver with the latter category the reference category.
The number of hours spent on in home and out of home caregiving were measured as separate quantitative variables and were later collapsed into categories (0 hours, 1-20 hours, 21-40 hours, 40+ hours).
Time-variant control variables
Educational attainment, work status, insurance status, existence of defined benefit plans, number of children in the household, and total family net income were control variables that could vary over these three time points.
Educational attainment was a quantitative variable ranging from one to 20 years of education. Respondents' work status was based on the information on hours per week respondents worked on their primary job. Respondents' work status consisted of three levels: “not working,” “working less than 30 hours (part-time),” and “working at least 30 hours (full time).” The reference category for respondents' work hours was "worked at least 30 hours."
Respondents were asked “Are you covered by any kind of health insurance or some other kind of health care plan? (Include health insurance obtained through employment or purchased directly as well as government programs like Medicaid that provide medical care or help pay medical bills.)” This was coded as an indicator variable with no insurance as the reference category.
Additionally, respondents were asked if they had a “pension or retirement plan (this question asks about employer plans both defined contribution and defined benefit)? Do not include Social Security, IRA or Keogh plans” across five different potential jobs. If they answered yes to this question for any job, the defined benefit pension plan variable was coded as one, and zero otherwise which would include the defined contribution plans such as 401ks, and without a plan acted as the reference category.
The number of children living in the household was a quantitative variable. Total family net income (TFNI) was a composite income figure created by the NLSY79 using several different income values for household members related to the respondent by blood or marriage. TFNI rather than the respondent’s income was used for this study to match the outcome variable measuring total family net worth. All TFNI were adjusted to 2016 value using the CPI-U correction factors, and all values were reported in thousands of dollars for ease of presentation.
Time-invariant control variables
Respondents' gender, age, and race/ethnicity were treated as time-invariant variables. While age does change across time, the change is confounded entirely with the time effect. Gender was recoded into an indicator variable with male as the reference category. Age at the time of the 2016 interview, in years (ranging from 51 to 60 years) was used as a control variable. Race/ethnicity was coded by NLSY79 into three categories: Hispanic, black, and white (non-Hispanic and nonblack). The reference category was white (non-Hispanic and nonblack).
Analytic Strategy
Given the import of representativeness with reference to the target population in large population-based studies, methodologists agree that a weighting procedure improves representativeness for cross-sectional studies. The longitudinal problem is more difficult because the procedure adjusts for participants not participating at every time period. The NLSY79 states that in practice, if the sample is limited to respondents at a terminal year, the weight for that year can be used since the weights by year only vary slightly. Therefore, the longitudinal analyses are weighted using the 2016 sample weights. Weighted demographic information, weighted using the appropriate yearly cross-sectional weight, is shown in Table 1.
All analyses are shown for the married and unmarried groups with the possibility of marital status changing across time for each respondent. Descriptive statistics include percentages for categorical variables and means for quantitative variables. Descriptive statistics are presented for each of the three time points. The primary analysis used for this study was a weighted repeated measures analysis with TFNW as the response variable and a combination of time-variant independent and control variables and time-invariant control variables. Repeated measures analysis only uses complete data with no missing values. The time gap of four years between each of the three periods examined in this study (2008, 2012, and 2016) makes it difficult to use imputation techniques without biasing results. A compound symmetry covariance structure that assumes all the variances were equal to each other and all the covariances were equal to each other was used for this study. Results not presented, considered autoregressive and unstructured covariance structures. However unstructured left too many parameters to estimate and autoregressive provided similar results. Appropriate analyses (not shown) were conducted to assess each model’s assumptions. Appropriate residual analyses were conducted to assess each model’s assumptions, and the residuals were found to be independent and identically distributed normal variables with a mean of zero and a constant variance. Mauchy’s test for sphericity was performed and the results were satisfactory. P-values and 95% confidence limits are reported to assist in interpretation of the analyses. Statistical analyses were conducted in SAS Version 9.4.
Results
What is the distribution of population characteristics over time?
To answer the first research question, Table 1 shows the weighted demographic profile of the sample of 3,614 respondents for this study for the three time periods stratified by marital status. While gender and race/ethnicity categories are time invariant, marital status is time variant and therefore the composition of the groups in gender and race/ethnicity vary slightly from year to year. The unmarried weighted sample was composed of approximately 48% males, 52% females, 7.5% Hispanics, 20.0% blacks, and 72.5% whites. The weighted mean age was 55.4 years in 2016 and the weighted mean years of education completed was 13.5. The married weighted sample was composed of approximately 58% males, 42% females, 5.0% Hispanics, 6.4% blacks, and 88.7% whites. The weighted mean age was 55.6 years in 2016 and the weighted mean years of education completed was 14.2. The weighted married sample was more likely to be male and white.
Table 1: Demographic profile of the analytic sample (n=3614) by marital status
|
Table 1: Demographic profile of the analytic sample (n=3614) by marital status |
|
|
|
|
|
|
|
|
|
|
|
|
||||||
|
|
|
|
|
Unmarried |
|
|
|
|
|
Married |
|
|
||||||
|
|
|
Year 2008 |
|
Year 2012 |
|
Year 2016 |
|
Year 2008 |
|
Year 2012 |
|
Year 2016 |
||||||
|
Explanatory variables (time variant) |
% |
Wgt % |
|
% |
Wgt % |
|
% |
Wgt % |
|
% |
Wgt % |
|
% |
Wgt % |
|
% |
Wgt % |
|
|
|
Health does not limit type of work for pay |
77.5 |
79.5 |
|
70.1 |
72.1 |
|
80.2 |
81.9 |
|
89.0 |
89.5 |
|
85.2 |
86.1 |
|
91.2 |
91.5 |
|
|
Health limits type of work for pay |
22.5 |
20.5 |
|
29.9 |
27.9 |
|
19.8 |
18.1 |
|
11.0 |
10.5 |
|
14.8 |
13.9 |
|
8.8 |
8.5 |
|
|
No CIOD in home |
92.9 |
93.5 |
|
91.2 |
92.6 |
|
91.0 |
92.4 |
|
92.1 |
92.9 |
|
88.3 |
89.0 |
|
86.6 |
87.6 |
|
|
CIOD in home |
7.1 |
6.5 |
|
8.8 |
7.4 |
|
9.0 |
7.6 |
|
7.9 |
7.1 |
|
11.7 |
11.0 |
|
13.4 |
12.4 |
|
|
Does not provide out of home care |
90.4 |
91.6 |
|
89.7 |
89.7 |
|
95.8 |
95.9 |
|
92.0 |
91.7 |
|
91.2 |
90.8 |
|
91.2 |
91.5 |
|
|
Provides out of home care |
9.6 |
8.4 |
|
10.3 |
10.4 |
|
4.2 |
4.1 |
|
8.0 |
8.3 |
|
8.8 |
9.2 |
|
8.8 |
8.5 |
|
Control variables (time variant) |
|
|
|
|
|
|
|
|
|
|
|
|
|
|
|
|
|
|
|
|
Not working |
7.1 |
7.1 |
|
8.5 |
8.6 |
|
9.3 |
9.5 |
|
8.4 |
8.8 |
|
7.4 |
7.1 |
|
8.9 |
9.5 |
|
|
Part time worker (< 30 hrs per week) |
16.0 |
12.7 |
|
20.7 |
17.1 |
|
26.5 |
23.1 |
|
8.0 |
7.7 |
|
10.7 |
9.4 |
|
14.5 |
13.0 |
|
|
Full time worker (> 30 hrs per week) |
76.9 |
80.2 |
|
70.8 |
74.3 |
|
64.3 |
67.4 |
|
83.6 |
83.5 |
|
81.9 |
83.5 |
|
76.6 |
77.5 |
|
|
Respondent is not insured |
25.4 |
22.9 |
|
22.4 |
13.2 |
|
13.7 |
7.6 |
|
7.7 |
6.9 |
|
8.9 |
7.4 |
|
4.9 |
3.6 |
|
|
Respondent is insured |
74.6 |
77.1 |
|
77.6 |
86.8 |
|
86.3 |
92.4 |
|
92.3 |
93.1 |
|
91.1 |
92.6 |
|
95.1 |
96.4 |
|
|
Does not have a defined benefit pension/retirement plan |
48.7 |
47.4 |
|
51.4 |
44.8 |
|
57.5 |
50.5 |
|
37.9 |
38.2 |
|
41.8 |
40.7 |
|
46.8 |
46.0 |
|
|
Has a defined benefit pension/retirement plan |
51.3 |
52.6 |
|
48.6 |
55.2 |
|
42.6 |
49.5 |
|
62.1 |
61.8 |
|
58.2 |
59.3 |
|
53.2 |
54.0 |
|
Control variables |
|
|
|
|
|
|
|
|
|
|
|
|
|
|
|
|
|
|
|
|
Male |
44.9 |
48.1 |
|
44.1 |
47.7 |
|
44.0 |
47.8 |
|
54.4 |
57.1 |
|
55.2 |
57.6 |
|
55.3 |
57.7 |
|
|
Female |
55.1 |
51.9 |
|
55.9 |
52.3 |
|
56.0 |
52.2 |
|
45.6 |
42.9 |
|
44.8 |
42.5 |
|
44.7 |
42.3 |
|
|
Hispanic |
19.5 |
7.5 |
|
19.5 |
7.4 |
|
19.6 |
7.5 |
|
17.4 |
5.0 |
|
17.4 |
4.9 |
|
17.3 |
4.9 |
|
|
Black |
40.3 |
20.6 |
|
39.9 |
20.1 |
|
39.8 |
19.9 |
|
16.8 |
6.3 |
|
16.9 |
6.4 |
|
16.9 |
6.4 |
|
|
White |
40.2 |
72.0 |
|
40.6 |
72.5 |
|
40.7 |
72.6 |
|
65.8 |
88.7 |
|
65.7 |
88.7 |
|
65.7 |
88.7 |
|
|
|
|
|
|
|
|
|
|
|
|
|
|
|
|
|
|
|
|
|
Dependent variable (time variant) |
std |
wgt mean |
|
std |
wgt mean |
|
std |
wgt mean |
|
std |
wgt mean |
|
std |
wgt mean |
|
std |
wgt mean |
|
|
|
Total family net worth (2016 $000s) |
374.2 |
186.7 |
|
339.0 |
166.6 |
|
453.8 |
224.8 |
|
691.4 |
491.5 |
|
747.8 |
526.8 |
|
1109.5 |
767.1 |
|
Control variables (time variant) |
|
|
|
|
|
|
|
|
|
|
|
|
|
|
|
|
|
|
|
|
Educational attainment (yrs) |
2.5 |
13.4 |
|
2.5 |
13.5 |
|
2.5 |
13.5 |
|
2.6 |
14.1 |
|
2.6 |
14.2 |
|
2.6 |
14.2 |
|
|
Number of children in household |
1.0 |
0.6 |
|
0.9 |
0.4 |
|
0.8 |
0.3 |
|
1.2 |
1.4 |
|
1.1 |
1.1 |
|
1.0 |
0.7 |
|
|
Total net family income (2016 $000s) |
51.1 |
55.2 |
|
46.7 |
52.8 |
|
76.8 |
58.4 |
|
96.8 |
136.7 |
|
107.8 |
138.9 |
|
161.4 |
146.2 |
|
Control variable (time invariant) |
|
|
|
|
|
|
|
|
|
|
|
|
|
|
|
|
|
|
|
|
Age in 2016 |
|
|
|
|
|
|
2.2 |
55.4 |
|
|
|
|
|
|
|
2.2 |
55.6 |
From 2008 to 2012 the number of respondents with work-limiting health conditions increased. However, this percentage reversed in 2016, possibly reflecting the increased percentage of respondents not working. The percentages for work-limiting health conditions in the unmarried group is nearly twice that in the married group. The percentage of respondents’ households having a CIOD member increased slightly over time for both married and unmarried groups, indicating that as respondents aged, they were more likely to become caregivers to someone in the home. The percentages of respondents with a CIOD in the household was slightly higher for the married versus the unmarried.
Descriptive statistics of other time-variant variables shown in Table 1 indicate that respondents were more likely to work part-time or not work at all as they aged. Both TFNW and TFNI (both in 2016 dollars) remained nearly unchanged from 2008 to 2012 but increased in 2016. As expected, the number of children in the household decreased as respondents aged and children moved out of the house.
What is the relationship of the respondent to the person with a CIOD, and how does this differ by marital status over time?
To answer the second research question, Table 2 details the weighted characteristics of household members who were CIOD by marital status and year. The top three CIODs were spouse/partner, child, and parent, with different rank order based on marital status. In the married group, spouse/partner was the most common CIOD household member across time, increasing from 64.4% in 2018 to 79.9% in 2016, followed by child and parent. In the unmarried group, parents were the most common CIOD household members with a slight decline over time from 36.6% in 2008 to 24.5% in 2016, followed by child or spouse/partner. In the unmarried group, there was a higher rate of caring for a sibling, friend or non-relative, grandchild, elder relative, or in-law compared to the married group.
Table 2: Household members that are chronically ill or disabled
|
Table 2: Household members that are chronically ill or disabled |
|
|
|
|
|
|
||||
|
|
|
Overall (n=5,173) |
|
Unmarried males (n=1,180) |
|
Married males (n=1,345) |
|
Unmarried females (n=1,402) |
|
Married females (n=1,246) |
|
|
|
Wgt % |
|
Wgt % |
|
Wgt % |
|
Wgt % |
|
Wgt % |
|
No disabled or chronically ill member |
87.9 |
|
91.9 |
|
87.3 |
|
90.3 |
|
83.4 |
|
|
Disabled or chronically ill member (CIOD) |
12.1 |
|
8.1 |
|
12.7 |
|
9.7 |
|
16.6 |
|
|
|
Which household member is CIOD1 |
% of CIOD |
|
% of CIOD |
|
% of CIOD |
|
% of CIOD |
|
% of CIOD |
|
|
Spouse or partner |
62.5 |
|
36.2 |
|
78.6 |
|
12.5 |
|
82.3 |
|
|
Child |
19.0 |
|
4.1 |
|
18.4 |
|
33.7 |
|
20.0 |
|
|
Parent |
10.3 |
|
22.9 |
|
5.2 |
|
25.9 |
|
2.6 |
|
|
Sibling |
7.4 |
|
28.4 |
|
0.8 |
|
18.7 |
|
0.0 |
|
|
Friend or non-relative |
3.3 |
|
6.1 |
|
0.0 |
|
9.5 |
|
2.0 |
|
|
Other relative |
1.4 |
|
4.9 |
|
0.0 |
|
2.4 |
|
0.8 |
|
|
Grandchild |
0.9 |
|
0.4 |
|
0.0 |
|
4.0 |
|
0.4 |
|
|
Elder relative |
0.4 |
|
2.6 |
|
0.0 |
|
0.3 |
|
0.0 |
|
|
In-laws |
0.5 |
|
1.8 |
|
0.0 |
|
1.3 |
|
0.1 |
|
|
|
|
|
|
|
|
|
|
|
|
|
|
|
min, max |
|
min, max |
|
min, max |
|
min, max |
|
min, max |
|
|
Number of household members with CIOD |
1, 5 |
|
1, 2 |
|
1, 2 |
|
1, 5 |
|
1, 4 |
|
1 There could be multiple chronically ill or disabled household members in a household; therefore, percentages add to more than 100% |
||||||||||
What are the patterns of caregiving over time?
To answer the third research question, the distribution of caregiving hours is presented in Table 3 for both married and unmarried groups, as is the breakdown of hours of caregiving both in and out of the home. In all cases, aside from those that don’t have caregiving hours, the largest category was caregiving for one to 20 hours both inside and outside the home. The mean hours of caregiving inside and outside the home was larger for people who were unmarried than married.
Table 3: Distribution of caregiving hours for the weighted sample by marital status
|
Table 3: Distribution of caregiving hours for the weighted sample by marital status |
|
||||||
|
|
Unmarried |
|
Married |
||||
|
Caregiving level |
2008 wgt% |
2012 wgt% |
2016 wgt% |
|
2008 wgt% |
2012 wgt% |
2016 wgt% |
|
In home care 0 hrs |
95.3 |
94.8 |
94.7 |
|
96.1 |
93.4 |
92.4 |
|
In home care 1-20 hrs |
2.6 |
2.3 |
3.4 |
|
2.2 |
3.8 |
5.2 |
|
In home care 21-40 hrs |
1.1 |
1.3 |
0.9 |
|
1.0 |
1.2 |
1.2 |
|
In home care 40+ hrs |
1.1 |
1.6 |
1.0 |
|
0.7 |
1.7 |
1.2 |
|
|
|
|
|
|
|
|
|
|
Out of home care 0 hrs |
91.8 |
89.8 |
96.0 |
|
91.8 |
91.0 |
91.5 |
|
Out of home care 1-20 hrs |
6.6 |
8.7 |
3.0 |
|
7.7 |
8.4 |
8.0 |
|
Out of home care 21-40 hrs |
1.0 |
0.7 |
0.5 |
|
0.2 |
0.4 |
0.3 |
|
Out of home care 40+ hrs |
0.6 |
0.8 |
0.5 |
|
0.3 |
0.2 |
0.2 |
|
|
|
|
|
|
|
|
|
|
For entire sample |
wgt mean |
wgt mean |
wgt mean |
|
wgt mean |
wgt mean |
wgt mean |
|
Hours of in home caregiving |
1.8 |
2.4 |
1.9 |
|
1.1 |
2.3 |
1.8 |
|
Hours of out of home caregiving |
1.2 |
1.6 |
0.6 |
|
0.7 |
0.7 |
0.8 |
|
Only those providing care |
|
|
|
|
|
|
|
|
Hours of in home caregiving |
37.5 |
47.2 |
35.9 |
|
27.0 |
35.4 |
23.5 |
|
Hours of out of home caregiving |
14.6 |
15.2 |
15.7 |
|
8.9 |
8.2 |
8.9 |
Does identification as a caregiver have a differential impact on TFNW in a household with a person with a CIOD?
Many publicly available data sets ask about disabilities and/or health status among household or family members, while very few ask about caregiving. To answer the fourth research question, we tested the difference in TFNW in households with and without a CIOD family member. Within households with a CIOD we tested the difference in TFNW whether or not the respondent identified as a caregiver for the person with CIOD. This was a weighted repeated measures analysis (2016 sampling weights) over the years 2008, 2012, and 2016.
Our initial estimates used caregiving hours as independent variables, but none of the hours of caregiving variables were significant in the model, possibly meaning the amount of time is not as important as the presence of a CIOD. Subsequent estimates used binary variables, and indicated whether or not the respondent was a caregiver for the CIOD within the household. Results from this analysis show a significant negative effect on TFNW in households in which there is a CIOD, and no difference in the size of the coefficient estimate based on caregiving identity of the respondent. This suggests that the important factor influencing the size of TFNW is whether or not someone in the household is CIOD, regardless of the identity of a caregiver or the hours of care provided. Results are shown in Table 4.
Table 4: Repeated measures weighted parameter estimates for TFNW (2016 $K)
|
Table 4: Repeated measures weighted parameter estimates for TFNW (2016 $K) |
||||||
|
Effect |
Estimate |
Std Error |
95% Confidence Interval |
t |
p-value |
|
|
Intercept |
-1385.5 |
229.1 |
-1834.5 |
-936.4 |
-6.1 |
<0.001 |
|
Time variant variables |
|
|
|
|
|
|
|
Year (2008) |
-30.5 |
18.7 |
-67.1 |
6.2 |
-1.6 |
0.103 |
|
Year (2012) |
-46.5 |
18.4 |
-82.6 |
-10.5 |
-2.5 |
0.011 |
|
In household CIOD and caregiver |
-147.2 |
36.0 |
-218.0 |
-76.5 |
-4.1 |
<0.001 |
|
In household CIOD but not caregiver |
-146.2 |
48.9 |
-242.1 |
-50.2 |
-3.0 |
0.003 |
|
Limited health condition |
-53.1 |
19.0 |
-90.3 |
-15.8 |
-2.8 |
0.005 |
|
Outside household caregiver for CIOD |
73.3 |
20.5 |
33.1 |
113.5 |
3.6 |
<0.001 |
|
Married |
225.2 |
21.7 |
182.6 |
267.7 |
10.4 |
<0.001 |
|
Total family net income ($000s) |
2.8 |
0.1 |
2.6 |
2.9 |
44.8 |
<0.001 |
|
Part time worker (< 30 hrs per week) |
69.3 |
22.1 |
26.1 |
112.6 |
3.1 |
0.002 |
|
Not working |
-11.8 |
27.2 |
-65.1 |
41.5 |
-0.4 |
0.664 |
|
Number of children in household |
5.7 |
7.4 |
-8.8 |
20.2 |
0.8 |
0.440 |
|
Year 2008 * CIOD/caregiver |
124.8 |
52.8 |
21.3 |
228.3 |
2.4 |
0.018 |
|
Year 2008 * CIOD/not caregiver |
150.8 |
70.6 |
12.4 |
289.2 |
2.1 |
0.033 |
|
Year 2012 * CIOD/caregiver |
118.2 |
47.3 |
25.5 |
210.8 |
2.5 |
0.012 |
|
Year 2012 * CIOD/not caregiver |
122.2 |
63.2 |
-1.7 |
246.1 |
1.9 |
0.053 |
|
Year 2008 * Married |
-234.5 |
23.8 |
-281.2 |
-187.9 |
-9.9 |
<0.001 |
|
Year 2012 * Married |
-188.0 |
23.2 |
-233.5 |
-142.4 |
-8.1 |
<0.001 |
|
Time invariant variables |
|
|
|
|
|
|
|
Hispanic |
-97.3 |
39.1 |
-174.0 |
-20.5 |
-2.5 |
0.013 |
|
Black |
-159.9 |
29.2 |
-217.2 |
-102.6 |
-5.5 |
<0.001 |
|
Female |
-24.2 |
18.8 |
-61.0 |
12.6 |
-1.3 |
0.197 |
|
Highest grade completed |
38.4 |
3.7 |
31.1 |
45.7 |
10.3 |
<0.001 |
|
Age in years in 2016 |
17.8 |
4.0 |
9.9 |
25.8 |
4.4 |
<.001 |
|
The reference categories are male, white, non-CIOD/non-caregiver in home, non-caregiver outside of home, no limiting health condition, married, and work full time. |
|
|
||||
In home caregiving was excluded in subsequent analyses because of its relationship to having a CIOD household member with respect to total family net worth. Indeed, to avoid duplication and collinearity concerns, the caregiving variable was limited to out of home caregiving for the remaining research questions.
What is the relationship between health status, CIOD in a household member, and caregiving outside the home on TFNW?
The following process was used to assess research question number five. Given the initial results and the strong, significant relationship between marital status and TFNW, we conducted two weighted repeated measures analyses (again, with 2016 sampling weights) over the three time intervals (2008, 2012, and 2016) for each marital status using TFNW as the dependent variable. The model included both the time-variant independent variables of limiting health condition of respondent, CIOD in-home status, and caregiving status outside-of-home. It also included time-variant control variables of educational attainment, employment status, insurance status, presence of a defined benefit plan, number of children in the household, and total family net income (TFNI) time-invariant controls of gender and race/ethnicity, and age. Interaction terms were considered between the year of the study (2008, 2012, and 2016) and the three independent variables (analyses not shown); however, year of study interaction terms were not significant and were ultimately excluded. The reference categories are 2008, no limiting health condition, no CIOD in home, non-caregiver outside home, works full-time, respondent not insured, does not have a defined benefit plan, male, and white. The overall model was statistically significant, with a likelihood ratio chi-square of 1421.0 (p<0.001) and 1116.9 (p<0.001) for the unmarried and married groups respectively. The results of the weighted repeated measures analysis are shown in Table 5 for each marital status.
Unmarried group
For the unmarried group, results indicate that mean TFNW did not significantly change between 2008 and 2012, but did significantly increase by $28.2K (95% CI [$8.6K, $47.8K]) after accounting for all other variables. All three independent variables were significantly related to TFNW. Adjusted for all control variables, having a limiting health condition reduced mean TFNW by $33.7K (95% CI [$5.0K, $62.3K]), having a CIOD in the home decreased mean TFNW by $49.0K (95% CI [$9.2K, $88.8K]), and being a caregiver outside the home increased mean TFNW by $59.2K (95% CI [$24.3K, $94.1K]).
As expected, holding all other variables constant, more education, being insured, and an increased TNFI, mean TFNW increased. Females had $37.7K (95% CI [$1.1K, $74.3K]) less in mean TNFW than males, and blacks had $116.0K (95% CI [$69.8K, $162.2K]) less in mean TFNW than whites. Working status, having a defined benefit plan, age, and the number of children in the household were not statistically related to TFNW.
Married group
For the married group, results indicate that mean TFNW did not significantly change between 2008 and 2012, but did significantly increase by $249.2K (95% CI [$209.4K, $289.1K]) between 2012 and 2016, after accounting for all other variables. All three independent variables were significantly related to TFNW. Adjusted for all control variables, having a limiting health condition reduced mean TFNW by $82.8K (95% CI [$14.9K, $150.7K]), having a CIOD in the home decreased mean TFNW by $79.7K (95% CI [$8.7K, $150.6K]), and being a caregiver outside the home increased mean TFNW by $75.4K (95% CI [$10.1K, $140.7K]).
As expected, holding all other variables constant, more education, older, and more TFNI are significantly related to an increase in mean TFNW. Respondents who had a defined benefit plan had a decreased mean TFNW of $76.6K (95% CI [$31.1K, $122.1K]). Females were not significantly different from males in TFNW. However, Hispanics were $131.3K (95% CI [$4.8K, $257.8K]) lower in mean TFNW than whites and blacks had $227.8K (95% CI [$116.6K, $339.0K]) less in mean TFNW than whites. Working status, insurance status, and the number of children in the household were not statistically related to TFNW.
Table 5: Repeated measures parameter estimates by marital status for total family net worth ($000s)
|
Table 5: Repeated measures parameter estimates by marital status for total family net worth ($000s) |
||||||||||
|
|
|
|
|
|
|
|||||
|
|
|
Unmarried |
|
Married |
||||||
|
Effect |
Estimate |
p-value |
95% Confidence Interval |
|
Estimate |
p-value |
95% Confidence Interval |
|||
|
|
Intercept |
-749.0 |
0.001 |
-1191.1 |
-306.9 |
|
-1865.9 |
<.001 |
-2570.5 |
-1161.3 |
|
Time variant explanatory variables |
|
|
|
|
|
|
|
|
|
|
|
|
Year (2012) |
-13.1 |
0.164 |
-31.5 |
5.4 |
|
33.9 |
0.072 |
-3.0 |
70.9 |
|
|
Year (2016) |
28.2 |
0.005 |
8.6 |
47.8 |
|
249.2 |
<.001 |
209.4 |
289.1 |
|
|
Limited health condition |
-33.7 |
0.021 |
-62.3 |
-5.0 |
|
-82.8 |
0.017 |
-150.7 |
-14.9 |
|
|
CIOD in home |
-49.0 |
0.016 |
-88.8 |
-9.2 |
|
-79.7 |
0.028 |
-150.6 |
-8.7 |
|
|
Caregiver outside of home |
59.2 |
0.001 |
24.3 |
94.1 |
|
75.4 |
0.024 |
10.1 |
140.7 |
|
Time variant control variables |
|
|
|
|
|
|
|
|
|
|
|
|
Educational attainment |
35.7 |
<.001 |
28.4 |
43.0 |
|
44.5 |
<.001 |
33.2 |
55.9 |
|
|
Part time worker (< 30 hrs per week) |
19.3 |
0.299 |
-17.1 |
55.7 |
|
56.1 |
0.133 |
-17.2 |
129.3 |
|
|
Not working |
10.8 |
0.541 |
-23.9 |
45.6 |
|
23.1 |
0.565 |
-55.7 |
101.9 |
|
|
Respondent is insured |
32.1 |
0.022 |
4.6 |
59.6 |
|
35.5 |
0.412 |
-49.3 |
120.3 |
|
|
Has a defined benefit pension/retirement plan |
-23.8 |
0.064 |
-48.9 |
1.4 |
|
-76.6 |
0.001 |
-122.1 |
-31.1 |
|
|
Number of children in household |
2.2 |
0.791 |
-13.8 |
18.1 |
|
5.5 |
0.620 |
-16.3 |
27.3 |
|
|
Total family net income ($000s) |
1.7 |
<.001 |
1.6 |
1.9 |
|
2.9 |
<.001 |
2.7 |
3.1 |
|
Time invariant control variables |
|
|
|
|
|
|
|
|
|
|
|
|
Female |
-37.7 |
0.044 |
-74.3 |
-1.1 |
|
-18.4 |
0.533 |
-76.2 |
39.4 |
|
|
Hispanic |
-63.0 |
0.074 |
-132.3 |
6.2 |
|
-131.3 |
0.042 |
-257.8 |
-4.8 |
|
|
Black |
-116.0 |
<.001 |
-162.2 |
-69.8 |
|
-227.8 |
<.001 |
-339.0 |
-116.6 |
|
|
Age in years in 2016 |
7.1 |
0.077 |
-0.8 |
15.1 |
|
24.4 |
<.001 |
12.2 |
36.6 |
|
The reference categories are 2008, no limitation, no CIOD in home, non-caregiver outside home, works full-time, respondent not insured, does not have a defined benefit plan, male, and white. |
||||||||||
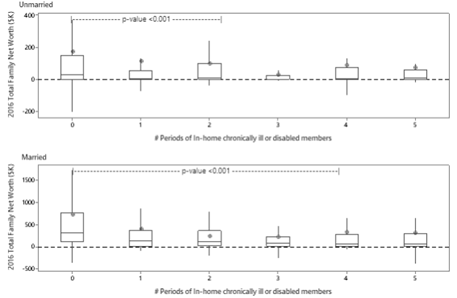
Longer term consequences of having a CIOD household member
To answer research question number six, Figure 1, divided by marital status, shows the adjusted mean TFNW for 2016 and the impact of having a CIOD inside the home over time. While three time periods are included in the longitudinal analyses presented previously (2008, 2012, 2016), there is information on CIODs also in 2010 and 2014. This means there was a potential of five time intervals in which a household could have a CIOD. The horizontal axis counts the number of times that the household reports having a CIOD member regardless of sequence. It shows that median and mean 2016 TFNW was at its highest if there never was a CIOD inside the home regardless of marital status. For the unmarried group, median 2016 TFNW is significantly higher when no CIODs are present than when a CIOD is inside the home for one, two, or three time periods. There is not a significant difference in median 2016 TFNW between one, two, or three time periods. The insignificant difference between zero and four or five time periods is most likely due to the smaller sample size. For the married group, median 2016 TFNW is significantly higher when no CIODs are present than when a CIOD is inside the home for any period of time.
Figure 1
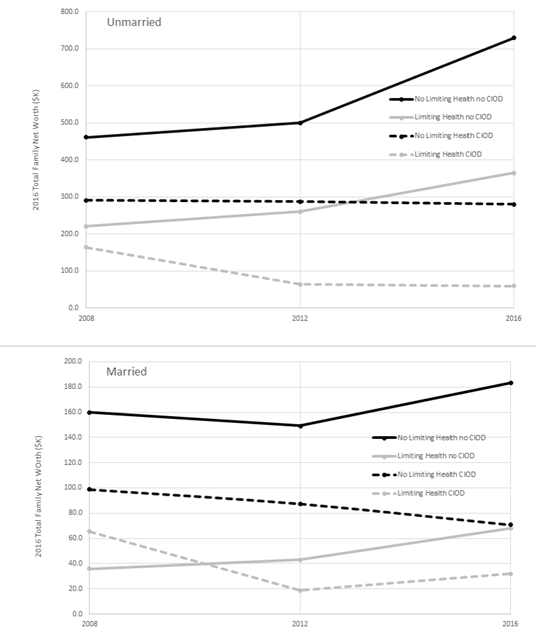
What is the additive effect on TFNW?
To answer research question number seven, Figure 2 highlights the additive effect of limiting health conditions and CIOD within the household. The mean TFNW trajectories show that for adults without a limiting health condition (black lines) that the additional responsibilities of having a CIOD household member reduced mean TFNW (dashed CIOD) and that the difference has widened over time, regardless of marital status. For adults with a limiting health condition (gray lines), the same pattern emerged except that in 2008 for the married group, the CIOD group had a higher mean TFNW. For the unmarried group, the difference in mean TFNW between those with and without a limiting health condition is $124.2K in 2008 and is pretty similar across time. Notice that most of the lines show an inflection point in 2012, indicating the slower economy during the 2007-2009 recession.
Figure 2
Discussion
The focus of this paper is on identifying groups that may be at higher risk in their retirement years so that preventive interventions can be employed to promote equity. Results from this study are of interest both for what they show and for questions they raise. Some items are particularly interesting for further consideration.
First, sensitivity testing indicates that families with members who are chronically ill or have disabilities have lower total net worth, whether or not the NLSY79 respondent identifies as a caregiver for that person (Table 4). This is a unique finding as no other study that we have found has looked at this distinction. This suggests the identification as a caregiver is not important when estimating the financial impacts of CIOD at the family level. This finding is particularly important for researchers as many datasets include information on health status of household members, but not on caregiving activity undertaken by each member for each possible care recipient. The possibility that CIOD could be used as a proxy for caregiving should be explored in future research.
Second, results show that the financial impact does not increase as the number of time periods with a family or household member with CIOD increases (Figure 1). In this study, total family net worth does not vary significantly between those with CIOD household members for any versus all periods of time. This finding is in sync with findings from other published research (Butrica & Karamcheva, 2014; Wakabayashi & Donato, 2006). Some portion of the initial financial impact is likely the expenses associated with the onset of a chronic illness or disability, such as the need to purchase durable medical equipment or restructure housing to better accommodate the care recipient (NAC & AARP, 2015). There is a learning curve, and certainly many tasks may take less time as skills are gained. In fact, the evidence base shows that caregivers who receive training and other types of non-financial supports report better health status than those receiving only financial support (Calvó-Perxas et al., 2018), and from this research, we know there is a significant association between health limitations and TFNW.
Third, alternative model specification (not shown, but available by request from the first author) shows that hours of caregiving either in- or out-of-home do not significantly impact TFNW. This result fits with theory around joint decision making that goes on in married (and likely other multiple adult) households about division of labor to maximize benefits to the household (Maroto & Aylsworth, 2017; Tamborini & Purcell, 2016).
Next, results also show a significant, negative relationship between work-limiting health status and TFNW. Having a work-limiting health condition has an impact on TFNW that is similar to the impact of having a CIOD in the home and in the overall model, the effect of the two variables together on TFNW is additive as shown in Figure 2. Importantly, education, race and total family net income are protective in terms of total family net worth. This suggests addressing racial equity in educational access and income may be a valid method for addressing the deficits in TFNW for individuals with a work limiting health condition and/or a household member with a CIOD.
Another finding of interest, caregiving outside of the home is associated with higher total family net worth. Previous research suggests this may be likely because this type of caregiving is more prevalent among adults who are married, particularly married women, and marriage is strongly linked to higher net worth (Butrica & Karamcheva, 2014). However, the current investigation found unmarried women spend more time on average devoted to in home and out of home caregiving compared to married women. Published research also shows that caregiving inside the home is of higher intensity than caregiving outside of the home (Cook & Cohen, 2018), and more likely to bring on adverse health conditions (Caputo et al., 2016), suggesting that out-of-home caregivers are more likely to maintain employment and add to net worth while caregiving. Eleven percent of caregivers live more than one hour away from the person they are caring for outside their home, suggesting they may not be primary caregivers (NAC & AARP, 2015). Out-of-home caregivers are often caring for parents or grandchildren, groups for whom care may be shared with others. Several questions arise, particularly about caregiving outside the home. What tasks does this type of caregiving entail? Could it include bearing the financial costs of a paid caregiver who provides some care for the out-of-home care recipient? Our results show that out-of-home caregivers have higher TFNW, but it is possible that the relationship runs the other direction; that adults with high TFNW are more likely to become out-of-home caregivers than adults with lower TFNW? We know there are cultural aspects related to caregiving in- or out-of-home, but are there also generational aspects with respect to patterns of saving for retirement which might allow the choice of receiving care in- or out-of-home? Are out-of-home care recipients in worse (or better) health than in-home care recipients? These questions are not asked in the NLSY79, but are important to understanding the relationship between caregiving and financial planning for retirement and should be the focus of future research.
Policy Implications
The focus of this research is on the financial well-being of families in which U.S. adults are nearing retirement age. Given the 6 percentage point rise in in-home caregiving of household members with CIOD from 2014 to 2019 (NAC & AARP, 2020), our results have important financial implications for both families and the communities in which they live. Employers and policymakers can use these findings to develop policies that support both work and caregiving as even a single time period with a CIOD household member reduces total family net worth. A growing number of employers are supportive of their employees taking care of their own health care needs or serving as caregivers by offering flexible work arrangements, supportive supervisors, and employee assistance programs (Bainbridge & Brody, 2017; Peng, Xu, Matthews, & Ma, 2020; Simon, 2020).
With a brief exception via the Families First Coronavirus Response Act (DOL, 2020a) for a portion of 2020 for issues pertaining to COVID-19, the United States does not guarantee access to short term paid sick days, nor do Americans have universal access to longer term paid family or medical leave, lagging behind all other industrialized nations in these basic workplace accommodations (Salam, 2019). Many attempts have been made in Congress to improve the federal Family and Medical Leave Act by assuring up to 12 weeks of paid leave at 66% of income, but no permanent federal legislation has passed. The current FMLA guarantees unpaid leave and only for employees at workplaces with over 50 employees (DOL, 2020b; Family and Medical Leave Act of 1993, 1993) which covers only about 60% of the workforce (KFF, 2020). The FMLA allows leave for selfcare, but restricts leave to care for others to family members defined as a spouse, child, or parent (DOL, 2020b). In this study’s sample, there was a significant number of unmarried persons reporting that they were caring for an unmarried partner. Leave to care for a partner would not guarantee job protection placing these individuals in precarious situations with their employers.
Some spells are short in duration when employees need to take time away from work to care for themselves or stay home with an ill family member or accompany them to doctor’s visits. When these caregiving circumstances arise, having access to paid sick days or flexible work accommodations can be valuable resources for people and could prevent lost wages or even job disruptions which cumulatively impacts net worth overtime. Several states (13) and 35 municipalities across the U.S. have passed laws to guarantee sick leave between 5-9 days (National Partnership for Women and Families, 2021). The emergence of COVID-19 resulted in the passage of a temporary paid sick leave law that provided 14 paid sick days for anyone ill, quarantined or caring for a child whose school or child care facility closed (DOL, 2020a). The temporary program expired December 31st, 2020. The pandemic has perhaps renewed the push for a permanent federal sick leave law. Attempts to guarantee access to flexible work accommodations have been made at the federal level too in an effort to keep caregiving from causing work disruptions (Sellmaier, 2019; Rodgers, 2020).
In addition, to leave guarantees, policymakers could focus on supplementing caregivers’ incomes through the expansion of tax credits for caregiving, Social Security credits during longer periods of care, or even direct cash transfers. Informal family care is the foundation of long-term elder care. In a 2017 report, AARP estimated $470 billion of care was being provided by 41 million unpaid family caregivers (Reinhard et al., 2019), an amount that will increase over the next few decades as the proportion of those over 65 year of age rises in the US. For those caregivers providing care outside of the home, reform to long term care insurance policies, including reductions to the cost of purchasing them, could provide financial support.
Clinical Implications
Doctors, medical providers, and health centers could expand after hours and weekend appointments to better accommodate workers who have a CIOD family member, provide out of home care, or who are struggling with a medical condition that limits employment. Expansions of telemedicine, pharmacy-based clinics, and employer-based health care services (like getting flu shots or mammograms at work) can also make managing healthcare while working easier. Support at the federal level for family caregivers has been poorly funded, but includes the National Family Caregiver Support Program which funds case management, counseling, respite and caregiver training (Levine et al., 2010; National Family Caregiver Support Program, 2019).
Limitations
This study is not without limitations. The data collected and analyzed relied on respondents’ self-report. Although respondents are interviewed every two years, over-demanding recall may limit the accuracy of the information provided. While variables such as work-limiting health condition, household member with a CIOD, and TFNW have been collected in the NLSY79 for many years, another important limitation of this study is that we do not know the full duration of caregiving, as caregiving questions were asked beginning in 2008. We also do not have data on the type of care provided, the type of chronic illness or disability of the person with a CIOD or a work-limiting health condition, nor the extent and cost of medical expenses for the person with a CIOD that are borne by the family. The methodological decision not to utilize multiple imputation for missing data could be viewed as a limitation by some; this may influence generalizeability. Finally, due to the constraints described previously, the potential value of a defined benefit pension accounts was not included as part of the calculation of TFNW; however, this was treated as a control variable.
Conclusions
Attention to issues faced by adults with work-limiting health conditions and families with members with a CIOD is largely absent in U.S. social policies and urgent action by U.S. policymakers is needed. Some employers are responding to this need, but in a piecemeal fashion. This study examines longitudinal aspects of work-limiting health conditions, presence of a CIOD household member, and caregiving on total family net worth for married and unmarried respondents.
Unmarried respondents are more likely to have a work limiting health condition, serve as a caregiver to parents, a sibling, friend, or elder relative, and spend more hours on average caregiving both inside and outside of the home compared to married respondents. Married respondents are more likely to have a CIOD household member and serve as a caregiver for a spouse or child compared to unmarried respondents. In home caregiving does not influence TFNW when CIOD is in the model. This suggests CIOD may be a proxy for in home caregiving.
With respect to total family net worth, the binary caregiving variable was significant; however, the number of hours caregiving inside or outside the home was not significant. For both unmarried and married respondents, having a work limiting health condition and a CIOD household member was related to a decrease in TFNW and the effect of having both was additive. Education, race, and total family net income were related to TFNW in both groups. Conversely, out of home caregiving was related to an increase in total family net worth.
Although the financial costs of caregiving may not be those that loom largest in the minds of caregivers, they are substantial and have long term impacts. Political and institutional adaptations should be crafted to better protect workers and their significant others.
References:
Arora, K. (2016). How does dementia onset in parents influence unmarried adult children’s wealth? Social Science & Medicine, 152, 156–165. https://doi.org/10.1016/j.socscimed.2016.01.042.
Anderson, L., Hewitt, A., Pettingell, S., Lulinski, A., Taylor, M., & Reagan, J. (2018). Family and individual needs for disability supports (v.2) community report 2017. Minneapolis, Minnesota: Research and Training Center on Community Living, Institute on Community Integration, University of Minnesota. https://ici.umn.edu/products/docs/FINDS_survey_2018.pdf (accessed 10 March 2020).
Bainbridge, H.T.J., & Brody, T.R. (2017). Caregiving responsibilities for a child, spouse, or parent: The impact of care recipient independence on employee well-being. Journal of Vocational Behavior, 101, 57-66. doi:10.1016/j-jvb.2017.04.006.
Barnhart, W. R., Ellsworth, D. W., Robinson, A. C., Myers, J. V., Andridge, R. R., & Havercamp, S. M. (2020). Caregiving in the shadows: National analysis of health outcomes and intensity and duration of care among those who care for people with mental illness and for people with developmental disabilities. Disability and Health Journal, 13(1). https://doi.org/10.1016/j.dhjo.2019.100837.
Bengen, W. P. (1994). Determining withdrawal rates using historical data. Journal of Financial Planning, 7(4), 171-180. https://www.onefpa.org/journal/Documents/The%20Best%20of%2025%20Years%20Determining%20Withdrawal%20Rates%20Using%20Historical%20Data.pdf (accessed 10 March 2020).
Bond, T., & Porell, F. (2020). Examining the nest egg: The sources of retirement income for older Americans. National Institute on Retirement Security. https://www.nirsonline.org/wp-content/uploads/2020/01/Examining-the-Nest-Egg-Final-1.pdf (accessed 15 February 2021).
Bricker, J., Dettling, L. J., Henriques, A., Hsu, J. W., Jacobs, L., Pack, S., Sabelhaus, J., & Thompson, J. (2017). Changes in U.S. family finances from 2013 to 2016: Evidence from the Survey of Consumer Finances. Federal Reserve Bulletin, 103(3), 1–42. https://www.federalreserve.gov/publications/files/scf17.pdf (accessed 10 March 2020).
Buchanan, J. M. (1991). Opportunity cost. In J. Eatwell, M. Milgate, & P. Newman (Eds.), The World of Economics (pp. 520–525). Palgrave Macmillan UK. https://doi.org/10.1007/978-1-349-21315-3_69.
Bureau of Labor Statistics (BLS). (2020). Employee Benefits Survey. https://www.bls.gov/ncs/ebs/factsheet/defined-benefit-frozen-plans.htm#:~:text=In%202019%2C%2026%20percent%20of,formula%2C%20such%20as%20a%20pension.
Butrica, B., & Karamcheva, N. (2014). The impact of informal caregiving on older adults’ labor supply and economic resources: Final report. The Urban Institute. https://www.dol.gov/sites/dolgov/files/EBSA/researchers/analysis/retirement/the-impact-of-informal-caregiving-on-older-adults-labor-supply-and-economic-resources.pdf (accessed 10 March 2020).
Calvó-Perxas, L., Vilalta-Franch, J., Litwin, H., TurroÂ-Garriga, O., Mira, P., & Garre-Olmo, J. (2018). What seems to matter in public policy and the health of informal caregivers? A cross-sectional study in 12 European countries. PLoS ONE, 13(3), e0194232. https://doi.org/10.1371/journal.pone.0194232.
Capistrant, B. D., Berkman, L. F., & Glymour, M. M. (2014). Does duration of spousal caregiving affect risk of depression onset? Evidence from the Health and Retirement Study. American Journal of Geriatric Psychiatry 22(8), 766-770. doi:10.1016/j.jagp.2013.01.073.
Caputo, J., Pavalko, E. K., & Hardy, M. A. (2016). The long-term effects of caregiving on women’s health and mortality. Journal of Marriage and Family, 78, 1382-1398. doi: 10.1111/jomf.12332.
Chang, S-C., Crous-Bou, M., Prescott, J., Rosner, B., Simon, N. M., Wang, W., De Vivo, I., & Okereke, O. I. (2018). Relation of long-term patterns in caregiving activity and depressive symptoms to telomere length in older women. Psychoneuroendocrinology, 89, 161-167. https://doi.org/10.1016/j.psyneuen.2018.01.005.
Cook, S. K., & Cohen, S. A. (2018). Sociodemographic disparities in adult child informal caregiving intensity in the United States. Journal of Gerontological Nursing, 44(9), 15-20. doi:10.3928/00989134-20180808-05.
Department of Labor (DOL). (2020a). Families First Coronavirus Response Act: Employee Paid Leave Rights. https://www.dol.gov/agencies/whd/pandemic/ffcra-employee-paid-leave.
Department of Labor (DOL). (2020b). Family and Medical Leave Act. https://www.dol.gov/agencies/whd/fmla.
Eggleston, J., & Monk, R. (2019). Net worth of households: 2016. Current Population Reports P70BR-166, US Census Bureau, 4 pp. https://www.census.gov/content/dam/Census/library/publications/2019/demo/p70br-166.pdf (accessed 10 March 2020).
Family and Medical Leave Act of 1993, Pub. L. No. 103–3, Chapter 28 29 USC (1993). https://www.dol.gov/agencies/whd/fmla (accessed 10 March 2020).
Grinstein-Weiss, M., Charles, P., Guo, S., Manturuk, K., & Key, C. (2011). The effect of marital status on home ownership among low-income households. Social Service Review, , 475-503.
Kaiser Family Foundation (KFF). (2020). Paid family and sick leave in the U.S. https://www.kff.org/womens-health-policy/fact-sheet/paid-family-leave-and-sick-days-in-the-u-s/.
Knoll, M.A.Z., Tamborini, C.R., & Whitman, K. (2012). I do . . . Want to save: Marriage and retirement savings in young households. Journal of Marriage and Family, 74(1), 86-100. Doi: 10.1111/j.1741-3737.2011.00877.x.
Levine, C., Halper, D., Peist, A., & Gould, D. A. (2010). Bridging Troubled Waters: Family Caregivers, Transitions, And Long-Term Care. Health Affairs, 29(1), 116–124. https://doi.org/10.1377/hlthaff.2009.0520.
Maroto, M., & Aylsworth, L. (2017). Assess the relationship between gender, houisehold structure, and net worth in the United States. Journal of Family and Economic Issues, 38, 556-571.
Merrill Lynch/Age Wave. (2017). The journey of caregiving: Honor, responsibility and financial complexity. https://mlaem.fs.ml.com/content/dam/ML/Articles/pdf/CaregivingWhitepaper.pdf (accessed 16 Feb 2021).
Moussa, M.M. (2019). The relationship between elder care-giving and labour force participation in the context of policies addressing population ageing: A review of empirical studies published between 2006 and 2016. Ageing & Society, 39, 1281-1310.
Munnell, A. H., Hou, W., & Sanzenbacher, G.T. (2018). National Retirement Risk Index shows modest improvement in 2016. Issue in Brief 18-1. Chestnut Hill, MA: Center for Retirement Research at Boston College. https://crr.bc.edu/wp-content/uploads/2018/01/IB_18-1.pdf (accessed 10 March 2020).
Munnell, A. H., Webb, A., & Hou, W. (2014). How much should people save? Issue in Brief 14-11. Chestnut Hill, MA: Center for Retirement Research at Boston College. https://crr.bc.edu/wp-content/uploads/2019/12/IB_14-11.pdf (accessed 10 March 2020).
National Alliance for Caregiving and AARP (NAC & AARP) (2015). Caregiving in the US: 2015 Report. Bethesda, MD: NAC & Washington, DC: AARP, 2015. http://www.caregiving.org/wp-content/uploads/2015/05/2015_CaregivingintheUS_Final-Report-June-4_WEB.pdf (accessed 10 March 2020).
National Alliance for Caregiving and AARP (NAC & AARP) (2020). Caregiving in the US: 2020 Report. Bethesda, MD: NAC & Washington, DC: AARP, 2020. https://www.aarp.org/content/dam/aarp/ppi/2020/05/full-report-caregiving-in-the-united-states.doi.10.26419-2Fppi.00103.001.pdf (accessed February 15, 2021).
National Family Caregiver Support Program. (2019). National Family Caregiver Support Program: Administration for Community Living. Retrieved March 10, 2020, from https://acl.gov/programs/support-caregivers/national-family-caregiver-support-program.
National Longitudinal Surveys. (n.d.). National Longitudinal Survey of Youth: 1979. Income, assets & program participation. Retrieved October 26, 2017, from https://www.nlsinfo.org/content/cohorts/nlsy79/topical-guide/income/assets#general.
National Partnership for Women and Families. (2021, March). Paid sick days-state and district statutes. National Partnership for Women and Families. https://www.nationalpartnership.org/our-work/resources/economic-justice/paid-sick-days/paid-sick-days-statutes.pdf.
Parish, S. L., Shattuck, P. T., & Rose, R. A. (2009). Financial burden of raising CSHCN: Association with state policy choices. Pediatrics, 124 Suppl 4, S435-442. https://doi.org/10.1542/peds.2009-1255P.
Park, S. (2020). Caregivers’ mental health and somatic symptoms durign COVID-19. The Journal of Gerontolog: Series B, gbaa121. https://doi.org/10.1093/geronb/gbaa121.
Peng, Y., Xu, X., Matthews, R., & Ma, J. (2020). One size fits all? Contextualizing family-supportive supervision to help employees with eldercare responsibilities. Journal of Occupational Health Psychology, 25(5), 368-383.
Rainville, C., Skufca, L., & Mehegan, L. (2016). Family caregiving and out-of-pocket costs: 2016 report. AARP Research (November), https://www.aarp.org/content/dam/aarp/research/surveys_statistics/ltc/2016/family-caregiving-costs.doi.10.26419%252Fres.00138.001.pdf https://doi.org/10.26419/res.00138.001.
Reinhard, S., Feinberg, L. F., Houser, A., Choula, R., & Evans, M. (2019). Valuing the invaluable: 2019 Update. Charting a path forward (No. 146; Insight on the Issues, pp. 1–32). AARP Public Policy Institute. https://www.aarp.org/content/dam/aarp/ppi/2019/11/valuing-the-invaluable-2019-update-charting-a-path-forward.doi.10.26419-2Fppi.00082.001.pdf.
Rej, P.H., Tennyson, R. L., Lee, N. R., & Eisenberg, D. T. A. (2019). Years of caregiving for chronically ill and disabled family members is not associated with telomere length in the Philippines. Psychoneuroendocrinology, 103, 188-194. https://doi.org/10.1016/j.psyneuen.2019.01.019.
Rodgers, L.P. (2020). The impact of paid family leave on household savings. Labour Economics, 67, 1-13. https://doi.org/10.1016/j.labeco.2020.101921.
Salam, M. (2019, February 15). Could the U.S. Get paid family leave? It’s looking better than ever. The New York Times. https://www.nytimes.com/2019/02/15/us/paid-family-leave.html (accessed 10 March 2020).
Sellmaier, C. (2019). Integrating work and family responsibilities: Experiences of fathers of children with special health care needs. Journal of Child and Family Studies, 28, 3022-3026. https://doi.org/10.1007/s10826-019-01478-6.
Seltzer, M. M., Greenberg, J. S., Floyd, F. J., Pettee, Y., & Hong, J. (2001). Life course impacts of parenting a child with a disability. American Journal on Mental Retardation, 106(3), 265–286. https://doi.org/10.1352/0895-8017(2001)106%3C0265:LCIOPA%3E2.0.CO;2.
Sherraden, M. S., Birkenmaier, J., & Collins, J. M. (2018). Financial capability and asset building in vulnerable households. New York: Oxford University Press.
Shuey, K.M., & Willson, A.E. (2019). Trajectories of work disability and economic insecurity approaching retirement. Journals of Gerontology B Psychological & Social Sciences, 74(7), 1200-1210. doi:10.1093/geronb/gbx096.
Simon, T. (2020). Why employers should care about their employee caregivers. Benefits Quarterly, (first quarter), 32-35.
Social Security Administration (SSA). (2016). Income of the Population 55 or Older, 2014. SSA Publication No. 13-11871 (April). https://www.ssa.gov/policy/docs/statcomps/income_pop55/2014/incpop14.pdf (accessed 15 February 2021).
Tamborini, C.R., & Purcell, P. (2016). Women’s household preparation for retirement at young and mid-adulthood: Differences by children and marital status. Journal of Family Economic Issues, 37, 226-241.
Ulker, A. (2009). Wealth holdings and portfolio allocation of the elderly: The role of marital history. Journal of Family Economic Issues, 30, 90-108.
Unuigbe, A., Lee, Y., Vaughon, W., Kaufman, J., & Gallo, W. T. (2017). Differential changes in health measures by caregiving status: Hierarchical models. Work, Aging and Retirement, 3(4), 393-402. doi:10.1093/workar/wax005.
US Census Bureau. (2020). Quick facts United States. 2014-2018 American Community Survey 5-Year Estimates. https://www.census.gov/quickfacts/fact/table/US/PST045218 (accessed 10 March 2020).
van Dalen, H.P., & Henkens, K. (2020). The COVID-19 pandemic: Lessions for financially fragile and aging societies. Work, Aging and Retirement, 6(4), 229-232. doi:10.1093/workar/waaa011.
van Rijn, R.M., Robroek, S.J.W., Brouwer, S., & Burdorf, A. (2014). Influence of poor health on exit from paid employment: A systematic review. Occupational & Environmental Medicine, 71, 295-301. doi:10.1136/oemed-2013-101591.
Wakabayashi, C., & Donato, K. M. (2006). Does caregiving increase poverty among women in later life? Evidence from the Health and Retirement survey. Journal of Health and Social Behavior, 47(3), 258–274. https://doi.org/10.1177/002214650604700305.
Williams, A.M., Wang, L., & Kitchen, P. 2014. Differential impacts of care-giving across three caregiver groups in Canada: End-of-life care, long-term care and short-term care. Health and Social Care in the Community, 22(2), 187-196. Doi: 10.1111/hsc.12075.
Author´s
Address:
Patricia Patty Stoddard Dare
Cleveland State University, 2121 Euclid Avenue
Cleveland Ohio 44115
216-687-4568
p.stoddarddare@csuohio.edu
Author´s
Address:
Linda M. Quinn
Cleveland State University, 2121 Euclid Avenue
Cleveland Ohio 44115
216-687-4691
l.quinn@csuohio.edu
Author´s
Address:
Shirley L Porterfield
University of Missouri-St Louis, One University Blvd
St. Louis, MO 63121
314-516-4617
porterfields@umsl.edu
Author´s
Address:
LeaAnne DeRigne
Florida Atlantic University, 777 Glades Road
Boca Raton, FL 33431
561-297-3047
lderigne@fau.edu
Author´s
Address:
Miyuki Tedor
Cleveland State University, 2121 Euclid Avenue
Cleveland Ohio 44087
m.fukushima@csuohio.edu
Author´s
Address:
Cyleste Collins
Cleveland State University, 2121 Euclid Avenue
Cleveland Ohio 44115
216-687-4571
c.c.collins44@csuohio.edu