Responding to an Increased Minimum Wage: A Mixed Methods Study of Child Care Businesses during the Implementation of Seattle's Minimum Wage Ordinance[1]
Jennifer J. Otten, University of Washington
Katherine Getts, University of Washington
Anne Althauser, University of Washington[2]
James Buszkiewicz, University of Washington
Ekaterina Jardim, Amazon[2]
Heather D. Hill, University of Washington
Jennifer Romich, University of Washington
Scott W. Allard, University of Washington
1 Introduction and Background
For-profit and nonprofit child care centers and family homes (hereafter, referred to as child care businesses) provide crucial care and education for young children and jobs for workers. However, many U.S. child care workers earn wages low enough to qualify for public assistance. For example, in 2014, the average Washington State child care center teacher earned $12.82 an hour and the average assistant teacher earned $10.67 -- slightly more than the state minimum of $9.32, but well below the wage needed to support a family of three (Moore & Gertseva, 2015). Wages for U.S. child care workers have not kept pace with inflation for the last 20 years and hover just above the federal poverty line (Whitebook, Phillips, & Howes, 2014). It is estimated that more than one-third of U.S. child care workers receive some form of public assistance, most commonly public health insurance coverage and SNAP (Whitebook et al., 2014). Moreover, because child care workers are disproportionately female and African-American or Hispanic in places like Washington State, low wages paid to child care workers reflect broader patterns of gender and racial inequity in work earnings (WADEL, 2013; Whitebook et al., 2014).
Staff wages are one of the most important predictors of child care quality (Whitebook et al., 2014). Higher wages have been linked to lower turnover among child care workers, which translates to a better continuity of care for children (Whitebook, 2007). In King County, Washington in 2012, the turnover rate was 38% for child care teaching assistants and 18% for child care teachers; for comparison, turnover was 7% for elementary school teachers (WADEL, 2013; Whitebook, 2007). Because the material deprivation and stress associated with low income status may affect the mental and physical health of child care workers, there is reason to be concerned that such hardship will affect how health is valued and promoted overall in child care settings (Workforce, 2011).
With the primary source of income for centers being fees paid by parents, it is difficult for many centers to simply raise staff wages. High-quality child care programs are expensive and pose a significant financial burden for many families. In King County, Washington, the average cost of care for children ages birth to five can range from $12,683-$17,337 annually, depending on the age of the child (Keenan, 2014). To put this in perspective, child care in King County costs more than in-state tuition fees for a college student at the University of Washington (Keenan, 2014). Cost concerns are particularly relevant to low-income households, as state and local subsidies often do not make up the gap between the cost of care provision and what families can afford (Keenan, 2014). In order to maintain affordability, therefore, many centers are faced with trade-offs between costs to families and wages paid to staff.
There have been efforts in Washington State to improve child care worker wages through policy experiments. For example, from July 2000 through June 2003, the state legislature (via the Child Care Career and Wage Ladder Pilot) tested career and wage ladders in a small number of pilot child care sites that tied workers’ wages to their level of education and experience (Boyd & Wandschneider, 2004). State funds were used to pay additional wages based on educational advancement such that average hourly wage increased to $9.68 for workers in pilot sites, compared with $8.94 for staff in centers not participating in the program. While overall employee retention in the pilot sites was no different from comparison sites, researchers observed a significantly higher quality of care and more positive interactions between children and teachers in the pilot sites as compared with comparison sites (Boyd & Wandschneider, 2004). Wage Career Ladder funding was then approved through the Legislature in mid-2005 and carried into early 2011. Unfortunately, in 2011, to address state budget shortfalls, legislators discontinued funding for this pilot program (Burbank, 2016).
In the U.S., local minimum wage ordinances provide another avenue through which policy might increase the wages of child care workers. Recently, more than 63 localities and states in the U.S. have passed local minimum wage ordinances to improve the economic environment of low wage workers and increase the economic security and well-being of households (Economic Policy Institute, 2016). Many countries—including Britain, China, and Kenya—also have recently created or increased national minimum wage laws (OECD, 2015). Research on the effects of minimum wage laws on low-wage workers suggests that the policy increases wages but can also lead to small reductions in hours and employment as employers adjust to higher costs (Belman & Wolfson, 2014; Neumark & Wascher, 2008).
In April 2014, the City of Seattle, situated in Washington State, passed legislation to increase the minimum wage for all workers from $9.47 to $15 per hour incrementally over time (Council Ordinance No. 124490, 2014). The highest of its kind in the country when enacted, the Seattle minimum wage likely affects almost 3,000 child care employees serving approximately 18,000 children in Seattle child care settings (Seattle, 2014). The mandated wage increases should affect not only provider wages, but also centers’ budgets, tuition rates for families, and access to and quality of child care (Hill & Romich, 2017). Very little research, however, has examined how local minimum wage laws might affect the provision of child care.
In this article, we examine the impact of Seattle’s $15 minimum wage on the local child care sector. Our mixed methods study answers two key research questions: How is Seattle’s minimum wage ordinance affecting wages paid in the child care sector? Given these changes in wages, how does it appear that child care centers are responding to rising labor costs? To answer these questions, we analyzed three datasets: (1) state administrative data on approximately 200 Seattle-based child care businesses from 2014 to 2016; (2) an employer survey conducted annually from 2015 to 2017 of 41 child care centers impacted by the policy; and (3) in-depth interviews of 15 Seattle child care center directors.
1.1 Seattle’s Minimum Wage Ordinance: Timeline and specifics
In June 2014, the City of Seattle passed an ordinance mandating a minimum wage increase from $9.47/hour to $15/hour, to be phased in via incremental annual increases that began on April 1, 2015 and continued annually every January 1st until 2021 (Council Ordinance No. 124490, 2014). Employers with 500 or fewer workers nationally phased in to $15 more slowly than those with more than 500 workers. Similarly, employers paying toward an individual employee’s medical benefits phased in slower than employers not paying toward medical benefits. Because all child care businesses in Seattle at the time of the ordinance employed 500 or fewer employees, we expect child care businesses to follow one of the two wage phase-in schedules shown in Table 1 (Seattle, 2017).
Table 1. Minimum wage phase-in schedules for child care businesses with 500 or fewer employees in Seattle, Washington
|
Phase-in date |
Employer pays toward the individual employee’s medical benefits ($/hour) |
Employer does not pay toward the individual employee’s medical benefits ($/hour) |
|
April 1, 2015 |
$10.00 |
$11.00 |
|
January 1, 2016 |
$10.50 |
$12.00 |
|
January 1, 2017 |
$11.00 |
$13.00 |
|
January 1, 2018 |
$11.50 |
$14.00 |
|
January 1, 2019 |
$12.00 |
$15.00 |
|
January 1, 2020 |
$13.50 |
Indexed to inflation |
|
January 1, 2021 |
$15.00 |
Indexed to inflation |
Source: City of Seattle Office of Labor Standards.
2 Methods
The current paper and analyses are part of a larger study that is evaluating the impacts of the Seattle minimum wage ordinance on jobs and employment using administrative datasets and on employers, workers, and prices using primary data collection (Seattle Minimum Wage Study, 2015). The University of Washington Institutional Review Board (IRB) approved the administrative data analysis and the qualitative study. IRB guidelines deemed the employer survey, which focused on firms and non-profit organizations, as not involving human subjects and therefore exempt from IRB review.
2.1 Research Design
The current study’s three datasets provide a comprehensive picture of how the child care sector is being affected by the early implementation of Seattle’s minimum wage ordinance and how they might continue to be affected and to respond as the policy continues to phase in. First, state employment records were used to quantitatively describe current headcount, wage, and payroll of child care businesses before the policy was implemented and in the early implementation phases of the policy and to analyze when and to what degree Seattle child care businesses’ labor costs would be affected by the ordinance over time. Second, data from a survey of employers across sectors were used to examine how child care employers reported adjusting to policy phase-ins over time. Third, a set of semi-structured interviews with child care center directors was conducted after initial policy implementation and added to these data to provide additional context. This approach leverages the strengths of mixed quantitative and qualitative methods to provide a clear and in-depth picture on the topic (Creswell, Klassen, Plano Clark, & Smith, 2011).
2.2 Study Sample and Procedure
2.2.1. Administrative Data
We used administrative data from the state Unemployment Insurance (UI) program for the second quarters of 2014, 2015, and 2016, which correspond in time to pre-policy implementation and the first quarters of the first two phase-ins of the policy. The Washington State Employment Security Department (ESD) collects quarterly payroll records for all private sector workers employed in the State and covered by UI. These data include only workers who are on staff and normally receive a W-2 form at the end of the year; no data are collected for contractors or the self-employed. Establishments with multiple locations have the option of filing a separate UI account for each location or one common account, but most businesses with multiple locations do not break down their employment by location (Team, 2016b). To determine exact business locations, mailing addresses were geocoded to exact latitude and longitude coordinates and then used to determine if a business was located in Seattle. This analysis includes the business establishments that were primarily classified by the 6-digit North American Industry Classification System (NAICS) code as “Child Care Day Services” (i.e., 624410; n=192, 195, 218, in the three years respectively). Only four businesses combined multiple child care center locations under one account and all locations were in Seattle, thus they are treated as single businesses in this sample. A more detailed description of these data is described elsewhere (Jardim et al., 2017; Team, 2016b).
2.2.2. Survey Data
The team also conducted the Survey of Seattle Employers (SSE), which is a panel survey of employers with City of Seattle business licenses and workers subject to the minimum wage ordinance. Surveys were administered in three waves annually from 2015 to 2017, with each wave occurring after incremental policy phase-ins. The research team drew a stratified random sample of 3,870 from a sampling frame of 29,702 Seattle business license holders. Non-profit firms were oversampled because they had a high proportion of low-wage workers or those likely to be particularly affected by the ordinance (Romich, Allard, Althauser, Buszkiewicz, & Obara, 2017). The research team supplemented the business license holder sample with an oversample of 335 non-profit human service organizations identified from community directories. A more detailed description of the overall sample, sampling frame, and response rates are described elsewhere (Team, 2016a).
Potential respondents were invited to participate in the survey via a letter and surveys were completed by the Social Development Research Group at the University of Washington through telephone and web survey methods. A screening call determined if a firm or organization had employees subject to the ordinance and, if so, invited them to participate in a longitudinal survey study. Of the 4,115 businesses and nonprofits contacted by the SSE, 174 were identified to be child care centers and 133 of those centers responded to the screener survey. Of these 133 centers completing the screener, 64 were invited to complete a longer survey because they had operations in Seattle and workers earning less than $15 an hour. In Wave 1 (2015), 52 of the 64 eligible child care centers participated in the longer survey. The longer survey revealed that 46 of those 52 respondents had low wage workers and were located in the City of Seattle. Of these 46 centers, 42 completed Wave 2 (2016, 91% response rate) and 41 of the 42 Wave 2 completers responded in Wave 3 (2017, 98% response rate). Wave 1 surveys lasted between 20-45 minutes depending on whether they were completed via phone or internet. Wave 2 and 3 surveys were significantly shorter, lasting only 10-15 minutes each, because each excluded many demographic and personnel questions captured in Wave 1. No monetary incentives were offered during wave 1 or 2, but respondents completing wave 3 were given the option to select a charity to receive a one-time $15 donation in the respondent’s name. This paper includes results on child care centers that responded in all three waves (n=41). Analyses of within-wave data that included centers regardless of completion of all three waves produced nearly identical results; there were also no differences between those who completed the survey by phone or internet.
2.2.3. Interview Data
For the interviews, a convenience sample of child care center directors was chosen. The sampling frame included email addresses of center directors who had participated in prior online trainings with the UW Center for Public Health Nutrition and had agreed to be contacted about future study opportunities. Center directors were approached via e-mail with an invitation to participate, which described the purpose and methods of the study. In addition, key collaborators from the City of Seattle and Public Health—Seattle & King County who work with child care organizations emailed the study information to their listservs of center directors. Interested participants were instructed to apply for study consideration via a secure online REDCap survey that screened for study inclusion criteria, including being a child care center in Seattle, employing workers making less than $15/hour, and serving children aged 5 and younger. The screener also collected data on the program, including the number and ages of children in full-time and part-time care, number and type of employees, starting and average wages of employees, benefits offered to employees, and participation in government subsidy programs. Maximum variation sampling was used to recruit and enroll 15 of the center directors; this sampling method was selected a priori and used to purposefully include a set of centers that varied by size, geography, employee wages, employee benefits, and subsidy participation (Teddlie, 2007; Vitcu, Lungu, Vitcu, & Marcu, 2007). Twenty-six centers filled out the online screener. Eight centers did not meet the inclusion criteria. Additionally, three centers that filled out the screener did not respond to a request for an interview. One center director was interviewed per child care center and offered a $100 gift card for participation. Interviews with the final sample of 15 lasted approximately one hour and were conducted on-site at centers from March through May of 2016 (i.e., after two policy phase-ins, one in 2015 and one in 2016) by the same researcher to ensure consistency.
2.3 Data Collection and Measures
2.3.1. Administrative Data
The Washington State ESD collects quarterly payroll records from all employers who have employees covered by Unemployment Insurance in Washington. The State requires employers to report hours worked for hourly workers and either actual hours worked or total number of hours for salaried workers (Jardim et al., 2017). Variables in the ESD dataset include business and worker IDs, employer addresses, employer industry codes, individual quarterly hours, and individual quarterly earnings (Team, 2016b). Measures from the second quarter of 2014 (i.e., the quarter when the ordinance was passed but prior to implementation) and second quarter 2015 and 2016 (i.e., after the 2015 and 2016 policy phase-ins) are presented in this paper to illustrate the number of child care businesses and number of child care employees, average employee headcount, average hourly wage rates for businesses, and total payroll. Lastly, we estimate the cost of compliance for these businesses at each wage phase-in of the ordinance using the second quarter of 2014 as the baseline for these projections. Importantly the administrative data do not include the self-employed or contract workers, meaning that our findings will be limited to formal child care providers.
2.3.2. Survey Data
The SSE gathered self-reported information about business characteristics such as the number of employees and locations the firm had in Seattle and nationally, the products or services they provide, most common low wage job type at their firms, and profit status (for-profit or nonprofit). At baseline, for-profit firms were additionally asked if the business was family-owned, minority-owned, immigrant-owned, woman-owned, and/or a franchise. Baseline and follow-up surveys collected self-reports of business responses or planned responses to the ordinance, such as whether they had reduced employee head count or hours (or if they anticipated or planned to) or if they had increased the price of goods and/or services (or if they anticipated or planned to. These business characteristics and self-reported business or compensatory strategies will be presented in this paper by survey year.
2.3.3. Interview Data
A table of close-ended budget questions followed by a semi-structured interview format was used to collect rich qualitative and quantitative data. Prior to the interview, directors were asked to complete a table of monthly expenses and income sources. Then, during the interview, a series of open-ended questions were asked about budgets (e.g., sources of flexibility and worry in income and expenses), staffing, and perceptions about how the minimum wage would affect their business and budget. A semi-structured format was used to provide some uniformity in data collection but also to allow for flexibility to deviate into new or emerging topics (Miles, Huberman, & Saldaña, 2014). The interview guide was field tested with one child care director who was not included as part of the study sample. The final interview guide consisted of 24 open-ended questions and included recommendations to the interviewer for probing.
2.4 Data Analyses
2.4.1. Quantitative Analyses
Statistical analyses were conducted with Stata version 14 (StataCorp, 2015). We used descriptive statistics to characterize cross-sectional ESD data and SSE survey responses by year. The main quantitative outcomes of interest were (a) compliance cost estimates by wage phase-in over time and (b) differences over time in SSE survey responses. Given there is no way to distinguish which businesses do and do not provide health benefits or tips in the ESD data, we calculate costs of compliance for three wage phase-in points ($11, $13, and $15/hour). For each business, we calculate cost of compliance based on payroll structure in the second quarter of 2014. Cost of compliance shows a percentage increase in total labor costs needed to comply with a specific wage phase-in level if a business kept the same number of workers and did not change the number of hours they worked. Formally, the cost of compliance (denoted by “GAP”) is defined as:

where ![]() denotes
a business,
denotes
a business, ![]() denotes
a time period, and
denotes
a time period, and ![]() denotes
a worker in business. We calculate
denotes
a worker in business. We calculate ![]() for
each business in 2014. For the SSE survey analysis, two sample tests of
proportions were used to test for differences between survey time points.
for
each business in 2014. For the SSE survey analysis, two sample tests of
proportions were used to test for differences between survey time points.
2.4.2. Interview Analyses
Qualitative interviews were audio-recorded and professionally transcribed verbatim. A thematic analysis approach was used to guide data analysis (MacQueen, McLellan, Kay, & Milstein, 1998; Miles et al., 2014). This involved using the interview guide to develop a list of deductive codes and then identifying additional inductive codes as they emerged from the data (MacQueen et al., 1998). This process continued until a final codebook emerged. Using the finalized codebook, two researchers independently coded the same transcript. The researchers then iteratively discussed coding conflicts and reconciled them by discussing the discrepancies until consensus was reached. This process continued until the codebook contained all relevant codes and 80% agreement was attained between the two coders. One researcher coded the remaining transcripts using Dedoose Software and summarized aggregate findings. Two researchers discussed and summarized coded text into major themes as reported in the results section below.
3 Results
3.1 Administrative data
Table 2 shows the number of child care businesses and employees, average hourly wage rates, and payrolls in the second quarters of 2014 (i.e., when the ordinance was passed but prior to implementation), 2015 (i.e., after the first wage phase-in), and 2016 (i.e., after the second wage phase-in). As these data show, the total number of businesses and thus employees have slightly increased over time, but the average number of employees per child care business has remained about the same over time. The hourly wage rate slightly increased from 2014 to 2015 but remained about the same from 2015 to 2016. Total payroll increased from 2014 to 2015 but then decreased in 2016.
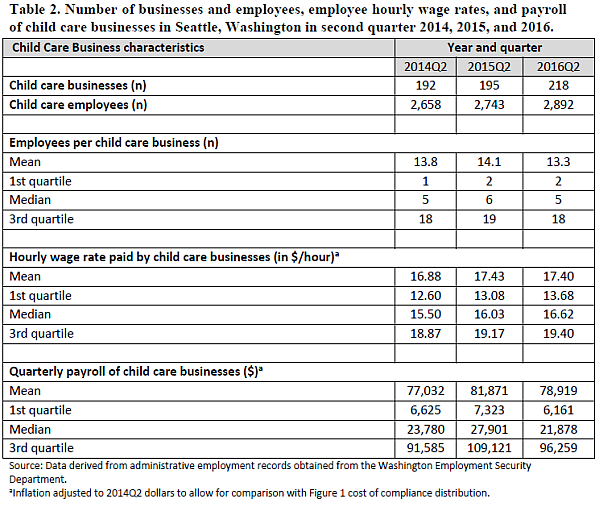
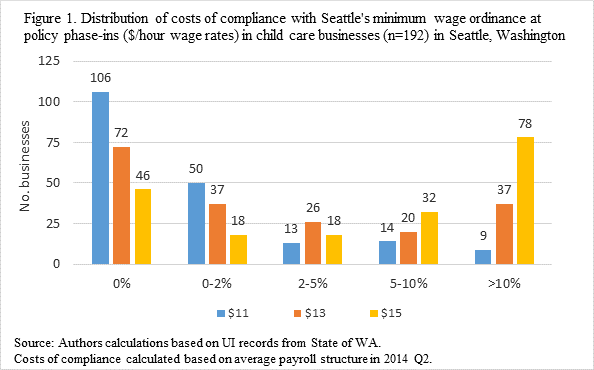
Figure 1 shows the cost of compliance distribution from zero to more than ten percent at the first, mid-way, and final wage rate phase-in (i.e., $11, $13, and $15 per hour) for child care businesses based on payroll structure. Projecting from second quarter 2014—slightly prior to the implementation of the ordinance—these findings indicate that the majority of child care businesses would not have incurred large costs in complying with the $11 minimum wage phase-in but that costs of compliance would have increased markedly as the wage phase-ins increased to $15 per hour. At $15 per hour, approximately 78 of the 192 businesses (41%) would have needed to increase payroll by more than 10%.
3.2 Survey data
Table 3 shows characteristics for child care centers surveyed across all three Seattle Employer Survey waves. The majority of child care centers were nonprofits (59%), had 10 or more employees in Seattle (71%), and operated at a single site. Among child care centers that self-identified as for-profit firms (n=17), the majority were family-owned (71%) and woman-owned (88%). Just under half of for-profit child care centers were minority or immigrant-owned (47%).
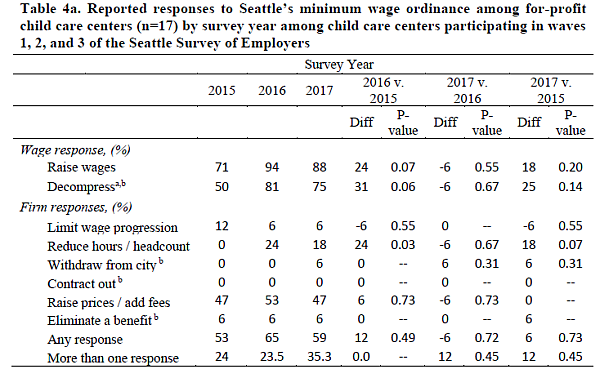
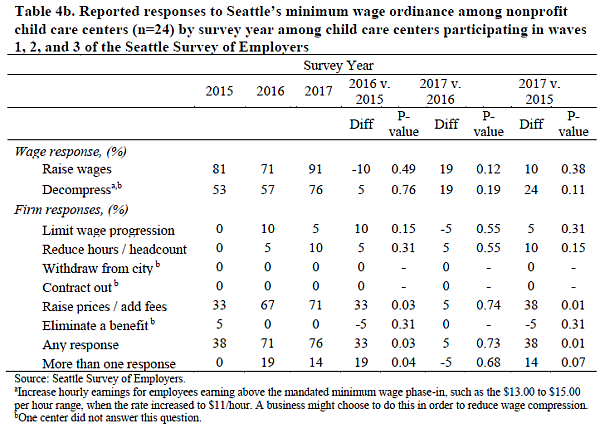
As shown in Table 4a and 4b, employers reported more changes in business practices over each successive wave of the minimum wage ordinance. By 2017, 90% of child care centers overall reported having raised prices in response to the ordinance, compared to 83% in 2016 and 76% in 2015. In 2016 and 2017, the majority of child care centers overall (71%) reported having to adjust their business strategy to respond to the ordinance in one or more ways; this value represented a significant increase since 2015 (44%, P = 0.014). Nearly a quarter of all surveyed child care centers reported having to adjust their business strategies in two or more ways by 2017, a decline of 2.4 percentage points from 2016 (P = 0.800) but an increase of 14.6 percentage points compared to 2015 (P = 0.078).
Similar to findings among the full sample of Seattle firms presented in Romich et al. (2017), the most common business strategy adjustment reported in 2017 was raising prices or adding fees (61%), and the use of this strategy was almost double from that reported in 2015 (Romich et. al, 2017). Also similar to full sample findings, the next most common business strategy adjustment reported in 2017 was reducing hours or headcounts. No child care centers reported reducing hours or headcounts in 2015 (Romich et. al, 2017).
Table 3. Baseline characteristics for child care centers (n=41) participating in Waves 1, 2, and 3 of the Seattle Survey of Employers by profit status
|
Characteristic |
For-profit
child |
Nonprofit child care centers (n=24) |
|
Number of Seattle employees, median (IQR) |
14 (3,25) |
20.5 (13,30) |
|
Number national employees, median (IQR) |
14 (2,28) |
22 (14.5, 30) |
|
10 or more Seattle employees, n (%) |
9 (53%) |
20 (83%) |
|
10 or more employees nationallya, n (%) |
9 (53%) |
21 (88%) |
|
Number of branches, median (IQR) |
1 (1,4) |
1 (1,5) |
|
Firm provides goods/services to customers inside Seattleb |
4 (24%) |
11 (46%) |
|
Firm is family-ownedc, n (%) |
12 (71%) |
- |
|
Firm is woman-ownedc, n (%) |
15 (88%) |
- |
|
Firm is minority or immigrant-ownedc, n (%) |
8 (47%) |
- |
Source: Seattle Survey of Employers
Notes: IQR=Interquartile range.
aThe baseline survey was fielded in advance of the city's writing of the Minimum Wage Ordinance regulations. Thus we asked about national employees, which was consistent with the understanding of the law in the months leading up to its enforcement. The current language of the law has been amended to include employees worldwide.
bA firm could have a physical location inside Seattle but provide goods/services outside Seattle, both inside and outside Seattle, or not be geographically specific (online business). Categories are mutually exclusive.
cOwnership status included only for-profit businesses.
3.3. Interview Data
Alone, administrative data and survey responses provide only a broad sense of how child care centers are adjusting to cope with the higher minimum wage. This section uses interview findings to provide depth and texture to the quantitative findings. First, we provide participant and center characteristics. Then, key information is presented from the budget worksheets and interview questions to illuminate (a) how child care centers budget and what factors compose their expenses and income and (b) how required staffing ratios, staff retention, and staff scheduling constrain their ability to respond to increases in labor wages. Within the categories of budget and staffing, we present data to illustrate the most cited ways in which centers have compensated or plan to compensate for increased labor wages due to the wage ordinance. Many directors reported on discussions with peers from other centers about which compensatory strategies they would implement to deal with the minimum wage ordinance. Some felt that smaller child care centers and low-income families would be hardest hit; as one director said, “I think it is going to be a huge burden on some of the smaller preschools and child care programs because, let's be frank, that's where most of the lower wages are.” As the ordinance phased in, most felt they would offset the increased labor wages in one or more of the following ways: increase income, reduce expenses, alter staff hours, and cut staff benefits or professional development.
3.3.1. Participant and Center Characteristics
All 15 participants were child care center directors and almost all reported playing a major role in developing budgets. The directors who were part of multi-site businesses (n=5) were less involved in budgets than directors of single-site businesses. Of the 15 sites, 13 accepted US Department of Health and Human Services (DSHS) subsidies; 13 participated in Early Achievers, which is Washington State’s quality rating and improvement system; 11 accepted City of Seattle subsidies; five participated in the Child Care and Adult Care Food Program (CACFP); and two participated in the Early Childhood Education and Assistance Program, which is Washington State’s version of the federal Head Start program. Additional child care provider and site characteristics are shown in Table 5.
Table 5. Characteristics of the sample of 15 Seattle-based child care centers
|
Characteristic |
Estimate |
|
PROVIDER |
|
|
Sex, Female, (n) |
15 |
|
Length of time working in child care industry, (median # of years, [range]) |
22, [5-40] |
|
SITE |
|
|
Profit status (n) |
|
|
Non-profit |
13 |
|
For-profit |
2 |
|
Age ranges served by sites (n) |
|
|
0 to 12 mo |
6 |
|
1 to 2 y |
12 |
|
2 to 5 yr |
15 |
|
Children Enrolled, (median, [range]) |
|
|
Full-time |
39, [20-130] |
|
Part-time |
22, [2-90] |
|
Monthly tuition rate by age, (median, [range]) |
|
|
Infants |
$1,692, [$1,200-$2,350] |
|
Toddler |
$1,535, [$1,040-$2,035] |
|
Young preschool |
$1,370, [$855-$1,815] |
|
Preschool |
$1,331, [$840-$1,650] |
|
Staffing, median, [range] |
|
|
Number of employees total |
18, [9-50] |
|
Number of full-time employees |
12, [5-46] |
|
Number of part-time employee |
4, [1-15] |
|
Number of salaried employees |
1, [0-44] |
|
Number of hourly employees |
16, [4-44] |
|
Wages, rate per hour (median per hour, [range]) |
|
|
Minimum hourly wage |
$12.00, [$12-15] |
|
Hourly wage |
$15.00, [$13-17] |
|
Benefits offered by child care centersa (n) |
|
|
Paid sick leave |
12 |
|
Paid time off |
15 |
|
Health insurance for employee |
11 |
|
Health insurance for employee’s family |
4 |
|
Retirement contributions |
8 |
|
Source: Interview data. aNot all staff are eligible.
|
|
3.3.2. Budget: How child care centers budget and budget-related compensatory strategies to Seattle’s minimum wage ordinance
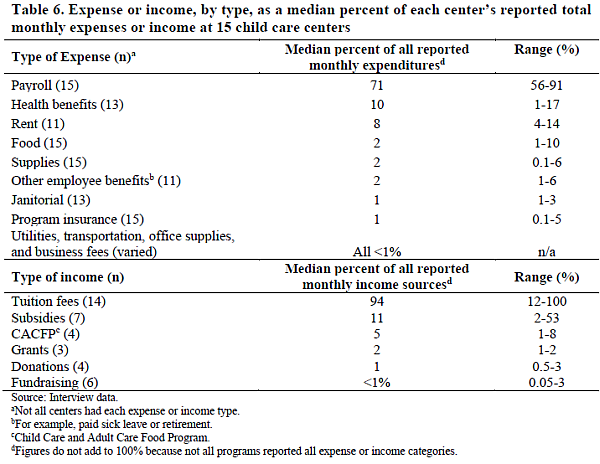
Budgeting was cited as the most stressful aspect of managing a child care center by almost half of the participants. All directors reported payroll as the expense they worried most about and this was the biggest monthly expense for all child care centers, followed by benefits. Together, median payroll and benefits comprised 81% of centers’ expenses. Interestingly, rent was only included as an expense by 11 of the 15 centers as some centers had their rent waived, such as by the church properties on which the center was sited. Child tuition made up the vast majority of income for almost all centers followed by subsidies. While one center did not provide responses for child tuition because the program was billed through the Seattle Preschool Program, nine of the center directors reported that tuition made up 87% or more of gross monthly income. Directors explained the mechanics of subsidies: the state-level Department of Social and Health Services (DSHS) subsidy is for families at 200% of the federal poverty level (FPL) or lower and centers absorb the difference in cost, typically 25-50%, between the subsidy and the tuition; the City of Seattle-level subsidy is for families at 300% of FPL or lower and families pay the difference between the subsidy and tuition rate. They perceived that the DSHS subsidies had not risen as quickly as the pace of tuition rates but reported that Seattle’s subsidy had recently been increased to track better with increased tuitions because of the minimum wage ordinance. See Table 6 for broad characteristics of expenses and income.
When asked which expenses were targeted when tightening budgets generally, center directors most often cited professional development and child care supplies. As one interviewee described,
“I think for flexibility it would be the staff training.[…] or supplies. […] So things that are more like a commodity then I have a little bit more flexibility on. But staff salaries, kitchen supplies to food to benefits, occupancy, those are all concrete. There's not much room to maneuver around.”
A few directors also mentioned that employee benefits and food budgets could be reduced in tight times. However, most described this as undesirable. An interviewee captured this by saying,
“I mean bonuses and things like that, I could take out. But, no, these are necessary to run a child care center. I mean you can't take away insurance. You can't take away your licensing fees. Health benefits I could certainly take away for sure, […] because that's quite considerable. We pay 85 percent of teachers' premiums, so that is … but I wouldn't want to.”
Directors discussed how they planned to absorb the increase in labor wages through increasing income and cutting expenses. While many centers reported they raised tuition rates annually to offset the increased cost of doing business, almost all centers said they had or would raise tuition even more in response to the wage ordinance. One director talked about this,
“So I actually started emailing several other directors when we were trying to plan what we were going to do … basically asking what they were going to do, right? And so pretty much all of them had like the same uneasy feeling that I did, like, oh, my God, there's really no way to do this other than to increase tuition. And so that's why I started calling other places to see if they had any other ideas, and pretty much, no. So everybody's sort of in the same boat. […] they were all pretty stressed out about it.”
Some directors perceived their families to be accepting of the tuition increases, while others said it was affecting the types of families they were serving. One director described that they had maintained their enrollees despite tuition increases,
“For the most part, they're accepting. There's some feedback that we get from parents [earning well above minimum wage] that they're not getting a five percent raise, they're not getting many raises because the … well the economy had been pretty stagnant, though it seems to be moving up now. We haven't lost anybody but I can tell it's a hardship for some people.”
Another director described the types of families that were getting squeezed out of the system from tuition increases,
“I just have to … there's a cause and effect for doing that. And I'm all for people making more money. But I just have to pass that cost down. And what it does, is it crowds out lower middle class people, which is essentially what I am. And that's a whole segment of our population that is just … can't afford housing, can't afford child care, they make too much to get any subsidies, not enough to get any help, and we're losing this whole segment of our population.”
Several center directors said they have had to reduce the number of enrolled families on the DSHS subsidy or knew of centers that had done this to reduce expenses. They explained how this change might also affect their staff who often need the DSHS slots for their own children,
“We used to have 25 percent DSHS families, and now we have six [percent].[ . . . ] As they left, we didn't enroll more. Because a lot of our staff, too, get DSHS. So they get the first DSHS spots, of course, but a lot of our staff get DSHS for their own children.”
Additional ways they offset the increasing wages included enrolling in the Seattle Preschool Program (a publicly funded preschool program, which subsidizes tuition for low-income families) to help guarantee income and tapping into new enrollee markets for extra income, such as families that need only part-time care.
Several directors reported they would need to cut expenses in addition to raising tuition in order to maintain the same level and affordability of care. The most commonly mentioned expenses they would cut included specialists (e.g., music or dance instructors), supplies, professional development, and staff hours. A director described these potential cuts,
“I mean I see the things that probably would end up going are things like specialists or things like professional development being cut back on, potentially supplies being cut back on. But probably I think tuition would go up more.”
Another director described how she cut staff hours to compensate,
“…in the last month I've had to have some of the people take an hour off their schedule. So instead of working eight hours, now they're working seven, […] but there was nothing else I could do.”
Less frequently mentioned and less preferred ways to cut expenses included offering cheaper employee healthcare plans, reducing staff sick leave, and increasing child-teacher ratio. One interviewee described the increase in child-teacher ratio,
“For example, in my one and two-year-old, I always just used to run on 10 kids and have three staff. But now I run on 12 because I have to do it for my budget. And that's stressful for people. And there's no … that's … money is the bottom line.”
3.3.3. Staffing: Required child care ratios, retention, scheduling and staffing-related compensatory strategies to Seattle’s minimum wage ordinance
A quarter of directors interviewed cited staffing (e.g., retention, scheduling) to be the most stressful aspect of their job. Directors described the minimum child-teacher ratios that are required for them to be licensed and as a key quality support both for children’s development and to reduce teacher burnout. At the same time, these minimum ratios constrain their options for responding to changes in labor wages.
Many directors reported that they had low turnover in their core staff but that assistant teacher positions turned over frequently and that turnover overall had been worse in recent years. As one director said, “Historically, it's been pretty low, but recently it's been pretty high in my preschool class. People can't afford to live on what we pay them.” Directors greatly valued their staff and to improve retention many offered benefits and higher salaries when they could. One director talked about the education, health, and other benefits her center offered and did not offer,
“Education benefits. We pay for their classes and that type of thing. As well as we offer paid vacation time, sick time. We offer dental insurance and eye insurance for those that don't have it. We opted as a group not to go with healthcare because it was just less expensive to go through the Health Care Authority than for us to have a group policy because […] it was less expensive for them to use that route than to have to pay part of the premiums here.”
Some directors also reported that staff scheduling stability was important because of the service they offered, while others tried to be as flexible as possible to support their staff. One director described the challenges with being flexible,
“We try to be as flexible as we possibly can, but also in this profession you're kind of based off families and really not us. When you're in this profession, you've got to be dedicated to these families and be one that is flexible with your own life and your own schedule because we have to make sure that we're always staffed.”
Another director explained how and why their center tried to be flexible,
“We're very flexible. It's a scheduling nightmare, but it's worth it, in terms of what we get back on our investment in our employees. We see our employees as our biggest asset and so we invest in them. We allow people to work different schedules every quarter. That's why we have a lot of part-time float people so they can cover those times when our other employees are taking classes.”
Directors expressed that staff appreciated the wage increase and that staff deserved to be paid more than they are currently paid, especially for the work they do. They acknowledged that most of their workers were not making livable wages and that many were living near poverty. However, they expressed concern about how their workers might feel about the identity shift implied by becoming “minimum wage workers.” This was anticipated to occur because workers making slightly above minimum wage prior to the law’s implementation, might not receive wage increases due to constraints on already limited child care budgets. An interviewee described this concern,
“I mean I'm conflicted. I think that it's good that people who do this type of professional work have to make more money, right, or that the bottom wages are going up. […] people working early childhood work for 10 or 11 dollars an hour doesn't feel right or fair, but I do think that this work should be significantly above minimum wage and now it is more minimum wage work.”
Many directors reported staff-related consequences to raising wages including wage compression, recruitment challenges, and training expectations. Directors commonly noted the unfairness in raising up the bottom-end of the pay scale while not also raising the top-end. They worried about how to compensate and retain their more experienced workers and one director described the negatives of wage compression,
“….now you have all these new people, you've been working in this industry, you have your degree for 10, 15 years, and you're making $15 an hour, 15 to 18 dollars an hour, now these people that have no experience and no certification are able to come in and make the same amount. So for me, what I'm trying to do is as the minimum wage has been going up, I've been raising it for everyone…but I don't know how long I can keep doing that.”
Some directors noticed that it is harder to recruit quality applicants, which they said may be related to the fact that less taxing jobs, such as fast food, now pay the same wage they offer. A director described this recruitment challenge,
“…increasingly, people can get jobs that are a lot less emotional, that are a lot less taxing for the same amount of money as we're able to offer. And so it's much harder for me to find staff who will do this job. Whereas if they could have like … if they were flipping burgers for $10 an hour and could work in child care for 13 or 14, then it would seem like a big difference. But if they could flip burgers for 13 or they could work in child care for 13, then flipping burgers I think is easier for people.”
Many directors explained that as they paid higher wages per employee that they expected to hire higher trained staff at entry or that staff would need to have greater training or education to earn the additional wage. . At the same time, they realized that the expectation of higher trained staff did not match the compensation they received, and one director described this tension,
“ … The sad thing about that though is that with the minimum wage going up for everyone … and this is my concern about the workforce … why should I go back to school when I can go to Walmart or Target or any other place and make the same amount without having the debt that comes with going back to school?”
4 Discussion
This study examined how the Seattle child care sector was affected by the initial implementation of the local minimum wage ordinance. Studies of the minimum wage often focus on restaurants, neglecting the many other industries in which minimum wage or near-minimum wage jobs are located. Our analysis of administrative data indicate that more than half of child care businesses in Seattle were affected as the policy increased to $13/hour and that the majority will be significantly impacted as the policy increases to $15/hour between 2019 and 2021. Our survey data from child care employers found that the most common strategic response to higher minimum wages over time has been to raise prices or fees and to reduce hours or headcount. Survey data also corroborate evidence in administrative data that showed a slight downtick from 2015 to 2016 in the average number of employees per child care business and the mean payroll for child care businesses.
Our analysis of interview data also supported and expanded on these quantitative findings. Specifically, we found employee wages and benefits comprised the majority of expenses and child tuition the majority of income, with only a few flexible expenses. Center directors valued their employees and offered what they could in lieu of higher wages (i.e., benefits, training, and flexible schedules). Interviewees felt that smaller centers and low-income families would be hardest hit by the ripple effects of the wage policy. Interview responses confirmed and expanded on the strategic responses reported in the survey data as well. Most center directors reported they would need a mix of strategies to increase income and reduce expenses. Increasing income via higher tuition rates was the most common strategy to cover higher costs, although center directors felt this was going to squeeze out low-income families who might transfer to unlicensed settings lacking standards of care. Centers commonly sought to reduce expenses by cutting specialists, supplies, staff training support, and staff hours. We found center directors less inclined to reduce staff benefits as a compensatory strategy. Some center directors worried about how the wage policy would impact staff wage compression and recruitment, especially now that more child care workers would become “minimum wage workers,” making other minimum wage jobs with the same pay but lower education requirements more attractive. Additionally, many center directors described their greater expectations regarding training in order to justify the higher wages, even though the cost of additional training may be a financial burden for workers.
4.1 Limitations
There are some limitations to the current study. One is that study findings are limited to the City of Seattle and may not be generalizable to other cities with different cost of living indices or internationally. However, findings are corroborated by a similar study in New York State (Shdaimah, Palley, & Miller, 2018). Second, the analyses in this paper are descriptive and should not be interpreted as causal findings. Third, because the administrative data do not include self-employed or informal workers, our findings are limited to formal child care businesses. Home and family child care providers may face very different budget constraints, but still be affected by market-based changes in the wage distribution of child care workers and the price of care. Fourth, while the employer survey was a probability sample, those who agreed to participate may have differed from those who did not. Finally, the small sample of interviewee respondents was purposively selected to represent a range of child care center types and may not be representative of all child care businesses in the city.
4.2 Implications and future research
Low wages are a persistent feature of child care jobs and affect the quality of care provided to children in the U.S. While child care centers responded to the Seattle minimum wage policy by raising worker wages, our findings suggest that their other responses could, at least partially, offset those gains. Many centers increased tuition costs to families or reduced the number of publicly subsidized spots, resulting in higher care costs and reduced availability for families unable to pay full tuition. Other responses, including cutting staff hours or increasing child to worker ratios, benefit neither workers nor children. In addition, policy implementation posed challenges to child care center staffing including wage compression and recruitment and presented some negative consequences to the workers themselves (e.g., reductions in staff hours and training support and yet increased expectations of training levels).
We believe there are many implications of this work for the field and practice of social work. First, local wage and workplace regulations appear to have important consequences for community-based nonprofits and human service providers (Seattle Minimum Wage Study, 2017) which create both opportunities and challenges for program managers. More than just affecting bottom-line payroll, such laws can shape organizational structure, mission, and service delivery. Thus, as more and more local places enact workplace regulations to foster more just and equitable labor markets, there is a role for social workers to contribute to policy discussions and implementation. Moreover, local workplace regulations – like higher minimum wages – point to the need for social workers to have well-rounded training that includes key management and budget skills necessary to navigate increasingly complex policy and social contexts.
These challenges underscore the need for a systems approach that addresses the heterogeneity of policy approaches for improving low wages (Schoeni & Russell Sage Foundation, 2008). In this case, a systems approach would consider the interactive nature and interdependence of external factors, such as the array of policies that support child care and the families enrolled in them, and internal factors, such as organizational constraints, to offset unintended negative consequences. This may include finding dedicated public funding to upgrade the financial support to the child care system and to improve workforce compensation via a transparent and equitable set of guidelines that incentivizes higher quality of care. For example, in 2016, the City of Seattle raised the payment it offers to low-income families needing assistance paying for child care in response to the wage ordinance to help retain low-income families in licensed care (Seattle, 2016). Other groups, such as the UC Berkeley Center for the Study of Child Care Employment and the U.S. Committee for Economic Development, have called for greater investments tied to a major reorganization of the child care delivery system (i.e., care pathways available to children including center or family based, non-subsidized or subsidized, alternative payment, head start, state-funded preschools etc…) and a professionalization of the field (Dorfman, 2005; Whitebook et al., 2014). Future studies should consider comparing wage internationally and examining how governmental financial support might play in quality outcomes for children and teachers. Future research should focus on designing and testing a systems approach to improving child care worker wages and to gain a better understanding of how a more systematic approach might affect the quality of care for the children they serve.
References
Belman, D. & Wolfson, P.J. (2014) What does the minimum wage do? Kalamazoo, MI: W.E. Upjohn Institute for Employment
Boyd, B. J., & Wandschneider, M. A. (2004). Washington State Child Care Career and Wage Ladder Pilot Project, Phase 2, Final Evaluation Report. Retrieved from https://del.wa.gov/sites/default/files/imported/publications/research/docs/CareerWageLadder_2004.pdf
Burbank, J. (2016). The Early Childhood Education Career and Wage Ladder: The unfunded link essential for high quality early learning. Retrieved from http://www.eoionline.org/education/early-learning/the-early-childhood-education-career-and-wage-ladder-2/
Council Ordinance No. 124490, 118098, City of Seattle City Council (2014).
Creswell, J., Klassen, A., Plano Clark, V., & Smith, K. (2011). Best practices for mixed methods research in the health sciences. Retrieved from https://www2.jabsom.hawaii.edu/native/docs/tsudocs/Best_Practices_for_Mixed_Methods_Research_Aug2011.pdf
Dorfman, L. (2005). Framing the Economic Benefits of Investments in Early Childhood Development. Retrieved from Berkeley, CA: http://www.bmsg.org/sites/default/files/bmsg_report_framing_the_economic_benefits_of_investments_in_early_childhood_development.pdf
Economic Policy Institute. (2016). Minimum wage tracker. Washington, DC: Economic Policy Institute. Retrieved from http://www.epi.org/minimum-wage-tracker/
Hill, H. D., & Romich, J. (2017). How Will Higher Minimum Wages Affect Family Life and Children's Well-Being? Child Development Perspectives. doi:doi:10.1111/cdep.12270
Jardim, E., Long, M. C., Plotnik, R., van Inwegen, E., Vigdor, J., & Wething, H. (2017). Minimum Wage Increases, Wages, and Low-Wage Employment: Evidence from Seattle. NBER, Working Paper No. 23532(JEL No. H7,J2,J3).
Keenan, N. V. (2014). Between a Rock and a Hard Place: King County’s Child Care Crisis. Retrieved from http://www.pugetsoundsage.org/downloads/Between%20a%20Rock%20and%20a%20Hard%20Place%202014.pdf
MacQueen, K. M., McLellan, E., Kay, K., & Milstein, B. (1998). Codebook development for team-based qualitative analysis. Cultural Anthropology Methods, 10(2), 31-36.
Miles, M. B., Huberman, A. M., & Saldaña, J. (2014). Qualitative data analysis : a methods sourcebook (Third edition. ed.). Thousand Oaks, California: SAGE Publications, Inc.
Moore, D., & Gertseva, A. (2015). Washington State 2014 Child Care Survey: Child Care Rate and Resources in Washington State, Technical Report 15-024. Retrieved from http://www.del.wa.gov/publications/communications/docs/2015%20Market%20Rate%20Survey%20Report%20Final.pdf
Neumark, D. & Wascher, W.L. (2008). Minimum wages. Cambridge, MA: The MIT Press
OECD (Organization for Economic Cooperation and Development). (2015). Recent labour market developments with a focus on minimum wages. In OECD employment outlook, 2015. Paris, France: OECD. Retrieved from http://www.oecd-ilibrary.org/
Romich, J., Allard, S., Althauser, A., Buszkiewicz, J., & Obara, E. (2017). Employer responses to a city minimum wage ordinance. Urban Affairs Review, https://doi.org/10.1177/1078087418787667
Schoeni, R. F., & Russell Sage Foundation. (2008). Making Americans healthier:social and economic policy as health policy. New York: Russell Sage Foundation.
Seattle, City of (2014). Seattle Preschool for All Initiative: Analysis of Preschool Enrollment. Retrieved from http://clerk.seattle.gov/%7ECFs/CF_313576.pdf
Seattle, City of (2016). Child Care Assistance Program Minimum Wage Mitigation Study. Department of Education and Early Learning. Seattle, WA.
Seattle, City of (2017). Minimum Wage Ordinance: Office of Labor Standards Issues Final Rule Revisions for City of Seattle Minimum Wage Ordinance. Retrieved from http://www.seattle.gov/laborstandards/ordinances/minimum-wage
Seattle Minimum Wage Study. (2015). Retrieved from http://evans.uw.edu/seattle-minimum-wage-study
Seattle Minimum Wage Study. (2017). Report on Nonprofit Response to Minimum Wage. Retrieved from https://evans.uw.edu/sites/default/files/Final%20Report%20to%20City%20of%20Seattle%20-%20Nonprofit%20Response%20to%20Minimum%20Wage%20Ordinance%20041417.pdf
Shdaimah, C., Palley, E., & Miller, A. (2018). Voices of child care providers: an exploratory study on the impact of policy changes. International Journal of Child Care and Education Policy, 12(4)
StataCorp. (2015). Stata Statistical Software: Release 14. College Station, TX: StataCorp LP.
Team, The Seattle Minimum Wage Study (2016a). Report on Baseline Employer Survey and Worker Interviews. . Retrieved from Seattle, WA: https://evans.uw.edu/sites/default/files/MinWageReport_April2016.pdf
Team, The Seattle Minimum Wage Study (2016b). Report on the Impact of Seattle’s Minimum Wage Ordinance on Wages, Workers, Jobs, and Establishments Through 2015. Retrieved from Seattle, WA: https://evans.uw.edu/sites/default/files/MinWageReport-July2016_Final.pdf
Teddlie, C. (2007). Mixed Methods Sampling: A Typology with Examples, Journal of Mixed Methods Research, 1(1), 77-100.
Vitcu, A., Lungu, E., Vitcu, L., & Marcu, A. (2007). Multi-Stage Maximum Variation Sampling in Health Promotion Programs' Evaluation. Journal of Preventative Medicine, 15(5), 5-18.
WADEL (Washington State Department of Early Learning) (2013). Early learning professionals in Washington, 2013 Workforce report. Retrieved from http://ececareers.del.wa.gov/sites/default/files/images/2013_workforce_report.pdf
Whitebook, M. (2007). Turnover Begets Turnover: An examination of Job and Occupational Instability Among Child Care Center Staff. Retrieved from http://cscce.berkeley.edu/turnover-begets-turnover-an-examination-of-job-and-occupational-instability-among-child-care-center-staff/
Whitebook, M., Phillips, D., & Howes, C. (2014). Worthy work, STILL unlivable wages: The early childhood workforce 25 years after the National Child Care Staffing Study. Retrieved from Berkeley, CA: http://cscce.berkeley.edu/files/2014/ReportFINAL.pdf
Workforce, Committee on Early Childhood Care and Education Workforce (2011). The early childhood care and education workforce: challenges and opportunities. A workshop report. Washington, D.C.: National Academies Press.
Author´s
Address:
Jennifer J. Otten, PhD, RD
Associate Professor
School of Public Health
University of Washington
jotten@uw.edu
Author´s
Address:
Katherine Getts, MPH, RD
Research Coordinator
School of Public Health
University of Washington
kgetts@uw.edu
Author´s Address:
Anne Althauser, MPH
Institutional Analyst
Institutional Data & Analysis
Office of Planning & Budgeting
University of Washington
aka17@uw.edu
Author´s
Address:
James Buszkiewicz, MPH
Graduate Research Assistant
School of Public Health
University of Washington
buszkiew@uw.edu
Author´s
Address:
Ekaterina Jardim, PhD
Economist
Amazon
ekaterinajardim@gmail.com
Author´s
Address:
Heather D. Hill, PhD
Associate Professor
Evans School of Public Policy and Governance
University of Washington
hdhill@uw.edu
Author´s
Address:
Jennifer Romich, PhD
Associate Professor
School of Social Work
University of Washington
romich@uw.edu
Author´s Address:
Scott W. Allard, PhD
Professor
Evans School of Public Policy and Governance
University of Washington
sallard@uw.edu