A Comparative Analysis of Manual and Computer Constant Comparison Methods: Using Data from a Constructivist Inquiry of Experiences Working with Ethnic Agencies
Suzie Weng, University of North Florida
1
In the ethnic agencies literature, there is a lack of research that falls in Burrell and Morgan’s (1994) interpretive paradigm emphasizing the subjective nature of individuals’ experiences. In the interpretive paradigm, there is the assumption that multiple realities exist among individuals. As such, science should be subjective and emphasize what is unique in relation to individuals’ creation of the world (O’Connor, Netting, & Thomas, 2008). Because of the importance of context in the interpretive paradigm, interpretive research designs capture the uniqueness of settings and provide deep meaning of a phenomenon. A study using a constructivist inquiry approach provides such understanding and then knowledge comes through from that understanding (Rodwell, 1998).
As a novice qualitative researcher in a doctoral level course, a constructive inquiry was conducted to understand the multiple realities and meanings of three individuals’ experiences working with ethnic agencies that serve Asian Americans. The course followed the constructivist methods by Rodwell (1998) and was taught by the same author. The students in the doctoral course were instructed to use the manual approach of data management and analysis in order to have a closer connection to the data and to experience the low-tech approach that they may not have chosen otherwise. According to Rodwell (1998), new constructivists tend to prefer the high-tech approach while the more experienced constructivists she knows prefer the manual approach. Rodwell (1998) recommends the selection between the methods be made in the planning stage of designing a constructivist research.
According to Denzin and Lincoln (2005), computers are beginning to play a bigger role in the analysis of qualitative data. Further, compared to Excel, use of Computer Assisted Qualitative Data Analysis Software (CAQDAS) is easier for managing and using data (Browning & Sørnes, 2008).CAQDAS such as Nudist, NVivo, and ATLAS.ti have been developed for that specific purpose. ATLAS.ti (2010) enables researchers to “…extract, categorize, and interlink data segments from a large variety and volume of source documents” (p. 5). For some, unfamiliarity and unwillingness to use computer-based data management programs can sometimes result in additional weeks of work (Sætre, 2010). The appropriateness of using computers to analyze qualitative data has been debated in literature (e.g., Bringer, Johnston, & Brackenridge, 2004).
With the goal of comparing the low-tech and high-tech methods of data management and analysis, the same data from the constructivist inquiry were used with CAQDAS. This assessment allowed for determination of the strengths and limitations of each during the various stages of data collection, management, and analysis. Additionally, the amount of time spent on each stage, the process required at each stage, and the end product were also reviewed. To fully compare the two approaches, a distance was created from the manual results while using ATLAS.ti so as not to be influenced by the analysis already completed. Only when all data were coded, all data and codes analyzed, and a network developed in ATLAS.ti were the manual results analyzed in order to write this article.
2 Review of Literature
Studies have found that Asian Americans do not access social services as much as other groups in the United States. In terms of mental health, only 17 percent of Asian Americans who had a psychiatric condition sought help and less than six percent used mental health programs (U.S. Department of Health and Human Services, 2001). Researchers have identified some barriers that are preventing Asian Americans from taking advantage of social services. These explanations include: cultural barriers, such as stigmatization of mental health problems; structural barriers, such as access and transportation; and language barriers (Aroian, Wu, & Tran, 2005). Ethnic agencies have emerged to meet the needs of this traditionally underserved population. In general, most scholars have defined ethnic agencies as nonprofit organizations that provide services to specific ethnic or racial groups.
Literature on ethnic agencies is mainly exploratory and descriptive in nature. Chow (2002) found many of the ethnic agencies provide comprehensive social and human services and the agencies fill an important gap within the service delivery system for the Asian American community. Literature has not addressed the meaning of an ethnic agency providing comprehensive services nor has it focused on what it means to the Asian American community for an agency to fill a gap in the service delivery system. Ethnic agencies have been found to have higher usage and return rates in terms of mental health services among Asian Americans compared to traditional social service agencies (Hu, Snowden, Jerrell, & Nguyen, 1991; Lau & Zane, 2000; Takeuchi, Sue, & Yeh, 1995). However, literature has not focused on client experiences with ethnic agencies or traditional social service agencies. In general, literature on ethnic agencies does not exist on the subjective nature of individuals’ experiences, including those who work with and for ethnic agencies.
3 Constructivist Inquiry
The original study was a constructivist inquiry, which is an approach to research that looks at a phenomenon through the experiences of individuals and their stories. The constructivist inquiry approach involves a mutual and negotiated process between the participants and the investigator in which the two collaborate in telling the story of the participants’ experiences (Rodwell, 1998). Each participant’s experience is incorporated with the experiences of other participants into a case report. It is an emergent process in which general research questions are used knowing that the interview may lead the researcher to a new direction (Charmaz, 2004).Emergence is important in constructivist inquiry with the understanding that the investigator is embarking on a study related to a phenomenon that is not well-known so the investigator cannot know exactly what to expect and his or her understanding of the phenomenon will increase throughout the study (Rodwell).
4 Data Collection
Foreshadow research questions and working hypotheses were developed prior to data collection based on literature and the investigator’s experience and knowledge. The research questions and hypotheses were updated throughout data collection with new information. Convenience sampling was employed with the goal of maximum variation so that as many constructions of reality would be included. The goal of the constructivist inquiry method is applicability that is bounded in context (Rodwell). Data were collected in natural settings (Guba& Lincoln, 1994) using face-to-face semi-structured interviews, which allowed for emergence, flexibility, and variation. Field notes were taken during the interviews and then expanded and recorded in an expanded field journal within 24 hours of each interview. Field notes and expanded field notes are preferred as a method of data collection “…because of their ability to use the human instrument at its highest potential for meaning making” (Rodwell, 1998, p. 71). Member checking to determine whether the researcher had accurately captured the voice of the participant took place during and at the end of the interview.
A follow-up email was sent to one of the participants because information was missed during the interview that was addressed in later interviews. This was an attempt to create a hermeneutic circle where “…a circle of information sharing be created so that perspective regarding claims, concerns, and issues are presented, considered, evaluated, understood, rejected, or incorporated into an emerging understanding of the phenomena under discussion or investigation” (Rodwell, 1998, p. 82). The hermeneutic circle is also crucial for consensus building at the conclusion of the data collection process. Consensus is sought through negotiation of each participant’s constructed reality but it is only possible “…in a hermeneutic process where all participants have equal voice about what is consented to and subsequently constructed” (Rodwell, p. 28). As such, a grand member check of all three participants took place upon the completion of the case report.
5 Data Management
5.1 Manual Method
An important aspect of naturalistic inquiry and constructivist research related to constant comparison is an audit trail (Lincoln &Guba, 1985). Leaving an audit trail means that an independent auditor will be able to trace a specific piece of data through each step of the research process. The components of an audit trail include the raw field notes, the expanded field notes, memos, and peer review journals updated throughout the data collection, coding, and analysis process. The raw field notes were recorded in a notebook where each line and page was numbered. In writing the expanded field notes, references were made to the pages and line numbers of the raw field notes. Data were broken down onto index cards during data analysis and each card referenced the line and page numbers of the expanded field notes. If data on the index cards needed to be placed in more than one category, duplicates of the cards were made and each card cross-referenced the others detailing the category and card number. During the writing of the case report, references were made to the index cards as footnotes. In each version of the case report, the footnotes were updated in accordance to the changes being made.A reflexive journal was kept to document the journey through the project. A methodological log was also kept to document methodological decisions and the rationale for each (Rodwell, 1998) as well asto help define and delineate theoretical categories (Charmaz, 1999).
5.2 Computer Method
In the computer method, data are managed using numerous active links. To start the computer method, a project file or hermeneutic unit was first linked to ATLAS.ti. This process loads the documents needed for analysis. The file contained interviews of individuals’ experiences working with ethnic agencies that serve Asian Americans. Once the interview documents were linked, coding began. ATLAS.ti (2010) defines coding as “…the process of assigning categories, concepts, or ‘codes’ to segments of information…” (p. 6). In other words, segments of information are linked to codes. Both the comment and memo tools were used throughout coding. According to ATLAS.ti (2010), “comments are always tied to other objects; they never stand alone” (p. 18). Comments were used to identify the interviewee (linked to the document), to add nonverbals from the interview (linked to the document), to note important text passages (linked to the data), and to define codes (linked to the codes). Unlike comments, memos did not have to be linked to other objects within the project file but they are linked to the project file itself. Memos were used for analysis of the data that included general thoughts and ideas during the coding and analysis process.
6 Data Analysis
6.1 Manual Method
The data were analyzed according to constructivist methods laid out by Rodwell (1998). Researcher reflection journaling and thematic analysis of data took place after each interview in an attempt to gain understanding as well as to revise foreshadow questions for the next interview. In constructivist inquiry, inductive data analysis is preferred to “…assure that the findings are grounded in the context of the inquiry” and that “…no fixed parameters are set to guide analysis decisions” (Rodwell, p. 58). Data were broken down into categories comprised of raw units of information from the expanded field notes and follow up emails. These raw units are the smallest piece of information that is understandable by itself. Then, “each unit of data is compared with each other unit in a process of constant comparison for analysis” (Rodwell, p. 58). This included “lumping” and “sorting” of index cards that contained raw units into categories and subcategories (Lincoln &Guba, 1985). Decision rules were noted throughout the process in a methodological log to assure consistency in coding. These rules were made about what belonged to categories to justify placing the card in one versus another category, why categories were denoted as subcategories, or why (sub)categories should be combined or separated. The sorting and lumping process was followed by the development of a conceptual map, detailed below. Finally, a case study was written as the last round of analysis.
A conceptual map was developed as a visual image to show the relationship between and among the major categories. An original conceptual map was started with all of the categories and subcategories from the lumping and sorting process. This conceptual map was too complicated because the structural relationship was too difficult to describe. According to Rodwell (1998), “until the inquirer can display the results in a simple graphic, illustration, or table, and until the results can be stated in no more than a paragraph, meaning has not been constructed” (p. 164). Several versions followed in order to simplify the map with the help ofa peer reviewer and feedback from the instructor and classmates. A peer reviewer was someone who could hear ideas, clarify aspects of the process, provide an external evaluation of the constant comparison process, read all products, and keep the researcher honest throughout the constructivist inquiry (Lincoln &Guba, 1985).With each version of the conceptual map, categories and subcategories moved to higher levels of abstraction. As a result, although the first and last version of the conceptual map had the same number of categories, they contained different content. The last version is presented in Figure 1.
Figure 1
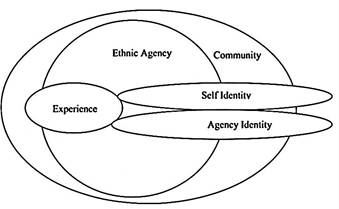
The conceptual map (Figure 1) shows that ethnic agencies are located in and related to the communities in which they serve. People’s experiences within the ethnic agency are influenced by the community, their self-identity, and the agency’s identity. Self-identity and agency identity are not only influenced by people’s experiences working for an ethnic agency and being part of the community, but from the outside as well.
6.2 Computer Method
Strauss and Corbin’s (1990, 1998) open and axial coding were employed during data analysis in ATLAS.ti.Open coding involves unitizing and coding simultaneously. The expanded field notes were broken down sentence by sentence to identify words and sentences that describe the phenomenon of individuals’ experiences working in an ethnic agency. Then, words and sentences were compared to identify categories and subcategories. Raw units were highlighted and assigned a code. New codes were created using the “open coding” option from the menu in ATLAS.ti. All new codes were defined with the comment tool using the “edit comment” option to open a text box where the definition could be typed. This allowed for each additional unit assigned to that code to be compared to the definition so that units assigned to each code were consistent. When codes were already created for other units, the text passages were highlighted, the code was selected in the “code manager” window, and then “dragged” and “dropped” into the selected text passage. Memoing took place using the memo tool in which text boxes were displayed to add identifying headings and thoughts and ideas about the study. This process continued until all expanded field notes were coded.
At the end of the first round of coding, axial coding in which comparisons are made at the category and subcategory level took place. All text passages that were broken down within each defined code were compared with one another. Text passages for each code were reviewed in accordance with the code definition to determine whether or not each text passage still fit the code. The codes and their definitions were then reviewed and consolidated to minimize repetition and allow for clear and defining categories. This process was repeated until all codes were well-defined and non-redundant, all text passages belonged to the code(s) associated with them based on the definitions, and the codes were connected to tell a story using the network view.
The network view in ATLAS.ti provides a visualization of how the key codes are related to one another. The network in Figure 2, displays codes relevant to the story of individuals’ experiences working with ethnic agencies that serve Asian Americans.
Figure 2
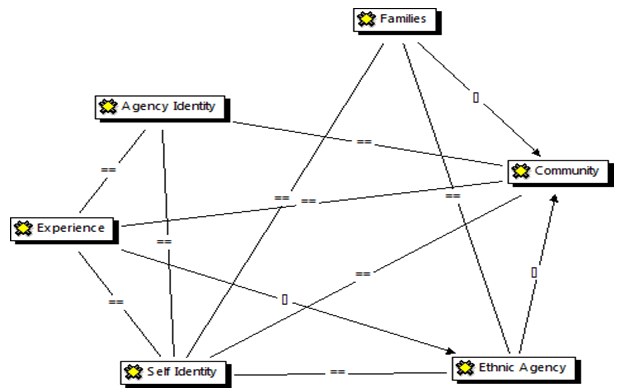
The network view (Figure 2) shows how the key codes of agency identity, experience, self-identity, ethnic agency, community, and families are all associated with one another. Starting at the top of the figure, families are part of the community and they are connected to ethnic agencies and individuals’ self identity. Moving counter clockwise, agency identity is related to the community as well as individuals’ experiences and their self identity. The experiences of the workers are part of the ethnic agency and are associated to agency identity, self identity, and the community. The self-identity of the interviewee is connected to all the major categories of the study: ethnic agency, community, families, agency identity, and experience. The ethnic agencies themselves are part of a community, they influence workers’ experiences, and they are related to families and workers’ self-identity. Finally the community influences families and ethnic agencies and is connected to agency identity as well as individuals’ experience and their self-identity.
7 A Comparative Analysis
The goal of this paper was to compare the high-tech and low-tech approaches to organizing and analyzing qualitative data for constant comparison using the same set of datafrom a constructivist inquiry. Using the same data set allowed for easier comparison of the strengths and weaknesses of both approaches.
7.1 Unitizing & Coding
In the manual approach, unitization of the data took place prior to the printing of the index cards and then coding. In the computer approach, unitizing and coding occurred at the same time. In the process of unitizing with the low-tech approach, references were added in parentheses to fully understand the context of each unit. With ATLAS.ti, comments were added to text passages to fully understand the context of each text passage. The constant comparison process in the manual approach called for physical index cards to be sorted into categories and subcategories bringing information together in successively higher levels of abstraction. This process provided a bird’s eye view of the lumps of categories important to the phenomenon under study. The number of index cards in each pile indicated the number of units that belonged to that category. Similarly, the numbers next to the codes in the “code manager” window in ATLAS.ti kept track of how many text passages were associated with that code.
7.2 Codes & Categories
While the term “codes” is used in ATLAS.ti and the term “categories” is used in the manual approach, they are essentially the same and can be used interchangeably. Table 1 details the final set of categories and the number of units within the categories. The main difference is that the computer method picked up the “families” category while the manual method did not. An analysis of the categories created between the two approaches showed that they were similar. This makes sense because the same person wasthe human instrument creating the categories for both approaches and both creations were based on the same exact data. The number of units for the manual method is much higher than that of the computer method. That is because the instructions for the breakdown of the data are different. In the manual method, data were broken down to the smallest piece of information that is understandable by itself (Rodwell, 1998) whereas in the computer method, data is broken down to something that stands for or represents a phenomenon (Strauss & Corbin, 1990, 1998). In this comparison, the categories that emerged were similar but the units within the categories were quite different.
|
Table 1 |
|||
|
Comparison of Categories & Number of Units |
|||
|
|
Number of Units |
||
|
Category |
Manual Method |
|
Computer Method |
|
Community |
65 |
|
12 |
|
Ethnic Agency |
173 |
|
41 |
|
Experience |
100 |
|
31 |
|
Self Identity |
110 |
|
11 |
|
Agency Identity |
135 |
|
33 |
|
Families |
N/A |
|
14 |
|
TOTAL |
583 |
|
142 |
Sometimes in constant comparison, a unit may make sense in more than one code or category. In ATLAS.ti, the multiple codes could be dragged and dropped from the "code manager" window to the relevant unit. With the low-tech manual approach, the process for adding one unit to multiple categories involved making duplicate copies of the unit's index card, adding one copy to every relevant category, and cross-referencing all the index cards to each other so that when looking at one card it would be known that the unit was also in other categories.
7.3 Conceptual Map/Network View
Both the conceptual map and the network view are visualizations of how the categories are connected to one another and they both capture the complexity of the phenomena of individuals’ experiences working with ethnic agencies. The goal of both is to display a simple graphic illustration for theory development. The stories told by the visualizations arenot the same, however, because they present different relationships. This is because the conceptual map allows for the “nesting” of shapes that allows circles be placed on top of one another. The network view uses boxes and lines to connect the relationships. Both visualizations portray associations between the major categories but the network view may imply causationdepending on the labelwith the connection of lines and usage of arrows while the nested circles provide association without expectation of cause.
8 Discussion
While personal preference may be a determining factor for new and more experienced constructivists in choosing the manual or computer approach, the purpose and the cognitive ability involved for each method should also be considered. The type of research question and purpose of the research should be a factor because the assumptions behind the two approaches are different. At the same time, the cognitive process for each approach may make one more suitable for some but not others.
The manual method guided by Rodwell (1998) places an importance on the data in which every datum was unitized and categorized. This process provides the researcher a closer connection to the data, allowing them to feel the data. The close connection to the data also allows for fewer chances of making mistakes and interpreting data incorrectly. The manual method provides room for creativity in the demonstration of anon-causal framework that makes the most sense in meaning-making. As such, if the research project is interpretive in nature and seeks the meaning of subjective experiences, the manual approach should be used. The lumps and the family tree created on the floor of a living room clearly show the categories, its subcategories, and the units within each. This visual representation provides an apparent relevance or importance of the categories and subcategories. If the goal of the constant comparison is to emphasize the importance of all data and create associational relationships between the categories, the manual method should be used.
The computer method guided by Strauss and Corbin (1990, 1998)has the goal of data reduction as a means to not get overloaded with data and to filter out as much noise as possible. The data reduction and potential causal nature of the method is problematic if the analysis is based on interpretive research with its emphasis on the uniqueness of individuals. As such, CAQDAS should be used if the research project is positivist or post positivist in nature. The computer method, however, allows the linear thinking person who works best in an if-then mode a clearer and more simplistic demonstration of data. At the same time, it requires the researcher to cognitively know the complexity in the background. Because the complexity of the data is not as apparent and the data itself is a bit more removed when using CAQDAS, it is easier to jump steps, making the data harder to interpret and easier to make mistakes. The computer method is less time-consuming and more efficient because unitizing and coding occurs at the same time, printing of index cards are not necessary, and connecting a unit to multiple codes requires only a simple drag and drop. The computer method also allows for an easier backup of the data. If the goal of the constant comparison is to reduce data and identify causal relationships between the categories, then CAQDAS should be used.
References
Aroian, K.J., Wu, B, & Tran, T.V. (2005).Health care and social service use among Chinese immigrant elders.Research in Nursing and Health, 28, 95-105.
ATLAS.ti. (2010).ATLAS.ti 6 quick tour.Retrieved March 19, 2010, from http://www.atlasti.com/uploads/media/QuickTour_a6_en.pdf.
Bringer, J. D., Johnston, L. H., & Brackenridge, C. H. (2004). Maximizing transparency in a doctoral thesis1: The complexities of writing about the use of QSR*NVIVO within a grounded theory study. Qualitative Research, 4(2), 247-265.
Browning, L. D., &Sørnes, J. (2008). The challenge of doing corporatized research: An ethnography of ICT use. Qualitative Inquiry, 14(7), 1223-1244.
Burrell, G., & Morgan, G. (1994).Sociological paradigms and organisational analysis. Brookfield, VT: Arena.
Charmaz, K. (1999). Stories of suffering: Subjective tales and research narratives. Qualitative Health Research, 9(3), 362-382.
Charmaz, K. (2004). Premises, principles, and practices in qualitative research: Revisiting the foundations. Qualitative Health Research, 14(7), 976-993.
Chow, J. (2002). Asian American and Pacific Islander mental health and substance abuse agencies: Organizational characteristics and service gaps. Administration and Policy in Mental Health and Mental Health Services Research, 30(1), 79-86.
Denzin, N. K., & Lincoln, Y. S. (2005). Introduction: The discipline and practice of qualitative research. In N. K. Denzin& Y. S. Lincoln (Eds.), The Sage Handbook of Quantitative Research (3rded.) (pp. 1-32). Thousand Oaks, CA: Sage Publications.
Guba, E. G. & Lincoln, Y. S. (1994).Competing paradigms in qualitative research. In N. K. Denzin& Y. S. Lincoln (Eds.), Handbook of Qualitative Research (pp. 105-117). Thousand Oaks, CA: Sage Publications.
Hu, T., Snowden, L., Jerrell, J., & Nguyen, T. (1991). Ethnic populations in public mental health: Services choice and level of use. American Journal of Public Health, 81(11), 1429–1434.
Lau, A., & Zane, N. (2000). Examining the effects of ethnic-specific services: An analysis of cost-utilization and treatment outcome for Asian American clients. Journal of Community Psychology, 28, 63–77.
Lincoln, Y., &Guba, E. (1985).Naturalistic inquiry. Newbury Park, CA: Sage Publications.
O’Connor, M. K., Netting, F. E., & Thomas M. L. (2008). Grounded theory: Managing the challenges for those facing institutional review board oversight. Journal of Qualitative Inquiry, 14(1), 28-45.
Rodwell, M. K. (1998). Social work constructivist research. New York: Garland Publishing.
Sætre, A. S. (2010). The challenge of doing corporatized research revisited: Contrivances and the presentation of self. Qualitative Inquiry, 16 (1), 57-65.
Strauss, A., & Corbin, J. (1990). Basics of qualitative research: Grounded theory procedures and techniques. Newbury Park, CA: Sage.
Strauss, A., & Corbin, J. (1998).Basics of qualitative research: Techniques and procedures for developing grounded theory (2nded.). Thousand Oaks, CA: Sage.
Takeuchi, D., Sue, S., & Yeh, M. (1995). Return rates and outcomes from ethnicity-specific mental health programs in Los Angeles. American Journal of Public Health, 85, 638– 643.
U.S. Department of Health and Human Services. (2001). Mental health: Culture, race, and ethnicity – A supplement to mental health: A report of the surgeon general. Retrieved February 20, 2010, from http://download.ncadi.samhsa.gov/ken/pdf/SMA-01-3613/sma-01-3613A.pdf.
Author´s
Address:
Suzie Weng
Assistant Professor
University of North Florida
USA
Email: suzie.weng@gmail.com